

Weather describes the day-to-day conditions of the atmosphere such as temperature, precipitation, and wind, whereas climate is the thirty-year statistical average of those conditions. In Leaving Certificate Higher Level Geography, this topic spans Optional Unit 9 (The Atmosphere - Ocean Environment), Core Unit 3 Higher Level Skills (synoptic weather charts, weather instruments, and satellite imagery), and Core Unit 2 (climatic regions, focusing on the cool temperate oceanic climate). The curriculum examines how the atmosphere and oceans work together as a global heat engine, the lifecycle and weather sequence of mid-latitude depressions and anticyclones, local wind systems, global climate regimes, human-induced climate change, and the economic impacts of rainfall, drought, and desertification.
1. Atmospheric and Oceanic Structure and Measurement
The atmosphere and oceans operate as an open, coupled thermodynamic system, continuously exchanging heat, moisture, and momentum across the planet.
Atmospheric Composition and Structure
Dry air in the lower atmosphere consists of roughly 78% nitrogen, 21% oxygen, and 0.9% argon. Trace components make up the remaining 0.1%, including carbon dioxide (roughly 0.04% or over 420 ppm), methane, and ozone. Variable concentrations of water vapour (near 0% in frozen polar air to 4% in humid equatorial air) and microscopic solid aerosols (such as sea salt, pollen, and dust) provide the essential surfaces required for condensation.
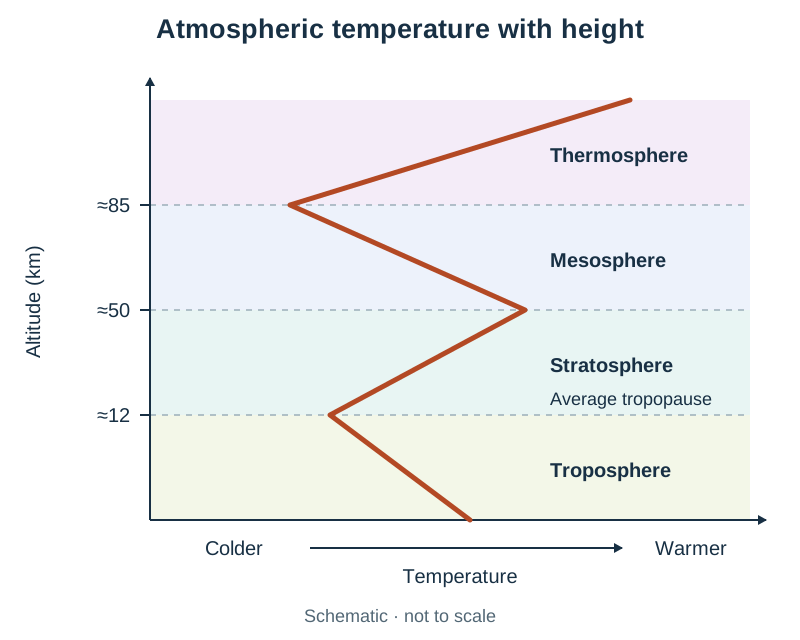
The atmosphere is divided into four concentric layers based on vertical thermal lapse rates:
- Troposphere: Extends from the surface to the tropopause, about 8 km over the poles and 18 km over the equator (averaging roughly 12 km globally). It holds 75% of atmospheric mass and almost all water vapour. Temperatures decrease steadily with height at the normal environmental lapse rate of roughly 6.5°C per 1,000 m.
- Stratosphere: Extends from the tropopause up to roughly 50 km. Temperature increases with altitude because ozone gas () in the ozonosphere absorbs incoming ultraviolet (UV) solar radiation.
- Mesosphere (50 to 85 km): Contains minimal ozone or water vapour; temperatures plunge below -90°C at the mesopause.
- Thermosphere (85 to 600+ km): Highly rarefied gases absorb shortwave solar X-rays, driving temperatures above 1,500°C.
Oceanic Structure and Salinity
Covering 71% of Earth's surface, oceans act as massive solar heat sinks. Average seawater salinity is 35 parts per thousand (35‰). Salinity is higher in areas of high evaporation and low freshwater input (such as the Mediterranean Sea at 38‰) and lower where heavy rainfall or melting ice dilutes seawater (such as the Baltic Sea).
The vertical water column comprises three layers: the sun-warmed surface mixed layer (0 to 200 m), the thermocline (200 to 1,000 m) where water temperature drops rapidly with depth, and the uniformly cold deep ocean layer (below 1,000 m), averaging 0°C to 3°C.
Meteorological Instrumentation and Siting Conventions
Accurate weather forecasting and climatic recording require standard instruments in strictly controlled sites:
| Element | Instrument | Metric Unit | Operational Siting Conditions |
|---|---|---|---|
| Air Temperature | Maximum-minimum thermometer | Degrees Celsius (°C) | Housed inside a white, double-louvred wooden Stevenson screen, positioned 1.2 m above short grass to prevent ground radiation or solar glare. |
| Atmospheric Pressure | Aneroid barometer or barograph | Hectopascals (hPa) / millibars (mb) | Kept indoors, calibrated to mean sea-level equivalent to eliminate altitude bias. |
| Wind Speed & Direction | Cup anemometer and wind vane | Knots or km/h; compass direction | Mounted 10 m above open ground, clear of turbulence from trees or structures. |
| Relative Humidity | Whirling hygrometer (wet-and-dry bulb psychrometer) | Percentage (%) | Swung in ambient air; the dry bulb measures air temperature while the wet bulb measures evaporative cooling. |
| Precipitation | Standard rain gauge | Millimetres (mm) | Sunk into turf with the rim set at 30 cm above ground, placed at least twice the height of nearby obstacles away. |
| Sunshine Duration | Campbell-Stokes recorder | Hours and tenths | A solid glass sphere focuses sunlight to scorch a calibrated card in an open metal bowl. |
In Ireland, Met Éireann operates synoptic stations including Valentia Observatory, Co. Kerry, which has logged standardised observations since the 19th century. Marine conditions are recorded by the Irish Marine Data Buoy Observation Network (buoys M2 to M6).
2. Earth's Heat Budget and Global Temperature Distribution
The global climate engine is driven by incoming shortwave solar radiation (insolation). The balance between incoming solar energy and outgoing terrestrial energy represents the Earth's heat budget.
The Planetary Heat Balance
For every 100 units of insolation entering the upper atmosphere:
- 30 units are reflected back into space by clouds, atmospheric gases, and reflective surfaces. This planetary reflectivity is the Earth's albedo (fresh polar snow reflects 80% to 90%, whereas open dark ocean water reflects under 10%).
- 20 units are absorbed by atmospheric gases and cloud droplets.
- 50 units are absorbed directly at the Earth's surface (continents and oceans).
The absorbed surface energy heats the land and ocean, which reradiate this energy upward as longwave infrared (terrestrial) radiation. Naturally occurring greenhouse gases—chiefly water vapour (), carbon dioxide (), and methane ()—absorb this outgoing longwave radiation and reradiate heat in all directions, including back toward the surface. This natural greenhouse effect maintains Earth's mean surface temperature at approximately +15°C; without it, global temperatures would drop to -18°C.
Heat moves through conduction (contact heating of the bottom air layer), convection (vertical uplift of buoyant warm air), advection (horizontal transport by winds and currents), and latent heat transfer (energy absorbed during ocean evaporation and released into the atmosphere during condensation).
Spatial Imbalance: Surplus and Deficit
Because the Earth is a sphere tilted on its rotational axis at 23.5°, insolation is distributed unevenly:
- Low latitudes between 35°N and 35°S receive high-angle, concentrated solar rays that travel through a thin layer of atmosphere with minimal scattering, creating an annual radiation surplus.
- Latitudes poleward of 35° receive low-angle, oblique rays that spread across a larger surface footprint, penetrate a deeper atmospheric path, and encounter high-albedo polar ice, creating an annual radiation deficit.
To keep the tropics from overheating and the poles from growing colder each year, excess heat moves poleward through atmospheric circulation cells (roughly 75% to 80% of heat transfer) and ocean surface currents (roughly 20% to 25%).
Why Temperature Varies from Place to Place
Six primary controls explain the distribution of temperature globally and across Ireland:
- Latitude: Lower solar angles at higher latitudes spread solar energy over wider surface areas. Singapore (1°N) averages 27°C year-round, while Reykjavik (64°N) averages 11°C in July.
- Altitude: Temperatures drop by roughly 6.5°C per 1,000 m ascent (environmental lapse rate) because the atmosphere is heated from the ground upward. Carrauntoohil (1,039 m) is typically 6°C colder than Killarney at its base.
- Distance from the sea (Continentality): Water has a high specific heat capacity, heating and cooling much slower than land. Valentia, Co. Kerry, has a mild maritime temperature range of 8°C (January 7°C, July 15°C). Moscow, at a similar latitude (55°N) but deep within continental Eurasia, has an annual range of 25°C (January -6°C, July 19°C).
- Ocean currents: The warm North Atlantic Drift raises Irish winter coastal waters to 8°C to 10°C, whereas the cold Labrador Current freezes coastal harbours at similar latitudes in eastern Canada.
- Prevailing winds: Ireland's prevailing south-westerlies blow over a warm ocean, bringing mild, moist air. Winds from continental interiors bring extreme summer heat or bitter winter cold.
- Aspect and albedo: South-facing slopes in the Northern Hemisphere receive sunlight at a steeper angle than north-facing slopes, warming soils earlier in spring (e.g., early potato cultivation in coastal Cork). High-albedo snow-covered surfaces reflect up to 90% of insolation, preventing surface warming.
Tri-Cellular Atmospheric Circulation and the Coriolis Effect
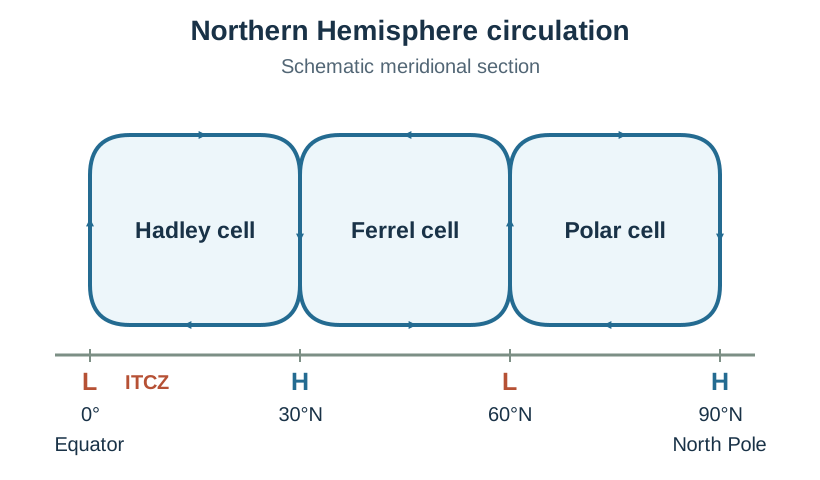
In each hemisphere, atmospheric heat redistribution is driven by three meridional cells:
- Hadley Cell (0° to 30°N/S): Intense equatorial insolation triggers strong convective uplift at the Intertropical Convergence Zone (ITCZ), creating an equatorial low-pressure belt with heavy daily downpours. Air travels poleward in the upper troposphere, cools, and subsides at 30° latitude to build the subtropical high-pressure belt. Subsiding air warms adiabatically, evaporating clouds and creating arid desert belts such as the Sahara. Surface air returns equatorward as the Trade Winds.
- Polar Cell (60° to 90°N/S): Radiative cooling at the poles creates dense, subsiding air and permanent high pressure. Outflowing surface winds form the Polar Easterlies, which collide with warmer air along the Polar Front at roughly 60° latitude.
- Ferrel Cell (30° to 60°N/S): A thermally indirect cell where surface air flows poleward from the subtropical high. The Coriolis effect—caused by Earth's west-to-east rotation—deflects moving parcels of air and water to the right in the Northern Hemisphere and to the left in the Southern Hemisphere. This deflection turns poleward-moving air into the prevailing Mid-Latitude South-Westerlies, which direct depressions toward north-western Europe.
3. Atmospheric Moisture, Hydrological Cycle, and Precipitation
Water circulates continuously between the oceans, atmosphere, and land surface via the hydrological cycle.
The Hydrological Cycle
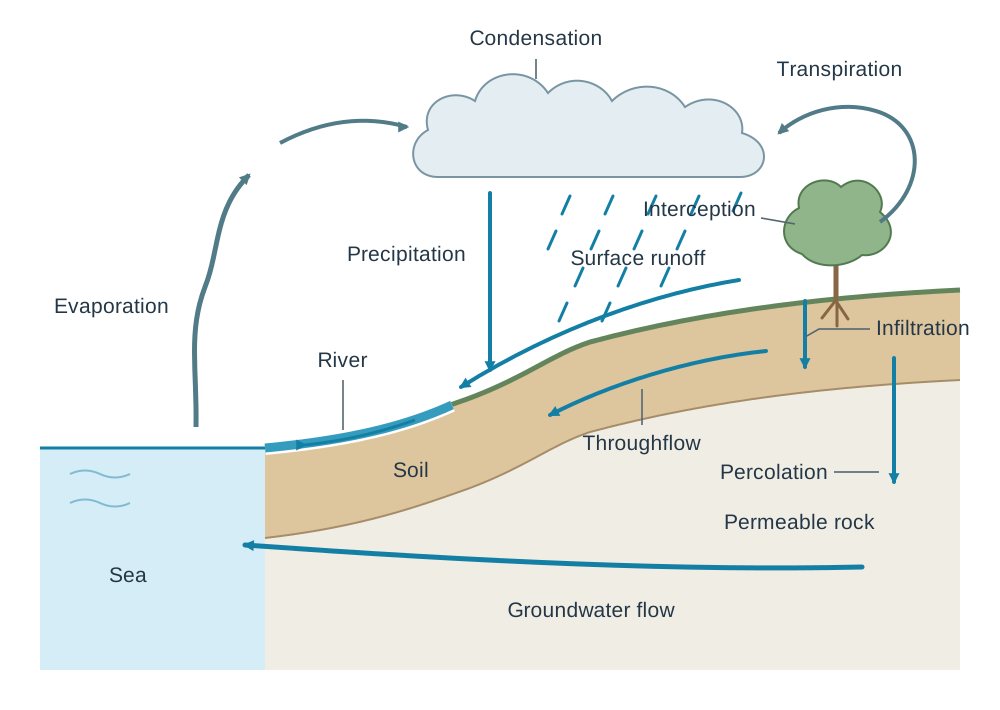
The hydrological cycle is a closed, global thermodynamic loop powered by solar radiation. Roughly 97% of Earth's water is stored in the oceans, about 2% is frozen in ice caps and glaciers, and under 1% exists as fresh liquid water in groundwater, lakes, and rivers.
- Stores: Oceans, atmosphere (water vapour and clouds), ice sheets, soil moisture, groundwater aquifers, vegetation, and surface water bodies.
- Transfers:
- Evaporation: Solar heating transforms liquid water into water vapour; roughly 86% of atmospheric moisture evaporates from the oceans.
- Transpiration: Plants draw groundwater through root networks and release water vapour through leaf stomata. Together with evaporation, this is termed evapotranspiration.
- Condensation: Ascending, cooling air reaches its dew point, transforming vapour into liquid droplets on condensation nuclei.
- Precipitation: Coalesced water droplets fall as rain, hail, sleet, or snow.
- Interception, Infiltration, and Percolation: Rain is caught by plant foliage, soaks into the soil surface, and migrates downward through permeable rock.
- Throughflow, Groundwater Flow, and Surface Runoff: Water travels downslope through soil and rock layers or across the land surface, returning to river channels and ocean basins.
Humidity and Adiabatic Processes
- Absolute Humidity: The actual mass of water vapour in a given volume of air ().
- Relative Humidity (RH): The ratio of actual water vapour in the air to the maximum water vapour capacity the air can hold at that temperature, expressed as a percentage:
Because warm air has a higher capacity for water vapour than cool air, chilling an air parcel increases its relative humidity. When air rises, it encounters lower barometric pressure aloft. The parcel expands; expanding molecules push against the lower surrounding pressure, expending kinetic energy and causing the parcel to cool internally. This is adiabatic cooling.
When a rising parcel cools to the temperature where its relative humidity reaches 100%, it hits its dew point. Below the dew point, water vapour condenses into liquid droplets on microscopic condensation nuclei (such as ocean salt spray, sulfate particles, or dust). Condensation releases latent heat into the air parcel, slowing its subsequent rate of cooling and helping drive further buoyant ascent.
Cloud Classification
Clouds are classified by altitude and structure:
- High Clouds (bases >6,000 m; ice crystals): Cirrus (wispy, fibrous white mares' tails), Cirrostratus (thin veil creating solar halos), Cirrocumulus (small, rippled white patches).
- Middle Clouds (bases 2,000 to 6,000 m; mixed droplets and ice): Altocumulus (grey-white rolls or flattened sheets) and Altostratus (uniform grey sheet diffusing the sun).
- Low Clouds (bases <2,000 m; water droplets): Stratus (low, uniform grey blanket yielding mist or drizzle), Stratocumulus (lumpy grey patches), and Nimbostratus (thick, dark, rain-bearing cloud providing continuous precipitation).
- Clouds of Vertical Development: Cumulus (puffy, flat-based dome clouds) can grow into Cumulonimbus—massive storm towers extending up to 12,000 m, capped with an icy, glaciated anvil head (incus).
Precipitation Types
- Relief (Orographic) Precipitation: Moist prevailing winds hit coastal mountain barriers and are forced to rise. The air cools adiabatically, condenses, and drops heavy rain on windward mountain slopes (e.g., MacGillycuddy's Reeks, Co. Kerry, exceeding 2,500 mm annually). As air descends the leeward side, it compresses and warms adiabatically, relative humidity falls, and a dry rain shadow forms across eastern lowlands (e.g., Dublin, receiving roughly 750 mm annually).
- Frontal (Cyclonic) Precipitation: Warm, less dense air mass collides with a colder, denser air mass. The lighter warm air is forced upward over the cold wedge, cooling adiabatically to form broad stratiform cloud decks that produce widespread, prolonged rain along warm and cold fronts.
- Convectional Precipitation: Strong summer sunshine heats the ground, which warms the overlying air by conduction. The warm air expands, becomes buoyant, and rises in vertical updrafts, condensing into cumulonimbus towers that generate short, intense downpours with thunder and hail, common across the Irish Midlands during warm summer afternoons.
4. Mid-Latitude Weather Systems: Depressions and Anticyclones
Ireland's weather is governed by the passage of frontal depressions and anticyclones steered across the North Atlantic.
Air Masses Influencing Ireland
- Polar Maritime (Pm): Originates over the cold North Atlantic off Greenland. Cool, moist, and unstable; brings bright intervals and frequent convective showers.
- Tropical Maritime (Tm): Originates over the warm Atlantic near the Azores. Mild, humid, and stable; brings overcast skies, hill fog, and continuous light drizzle.
- Polar Continental (Pc): Originates over Siberia and northern Scandinavia. Frigid and dry in winter, it picks up moisture across the Irish Sea to bring heavy snowfall to the east coast. For example, during late February 2018, the intense Pc outbreak known as the 'Beast from the East' produced severe blizzards when it met the moist Atlantic low, Storm Emma, in early March.
- Tropical Continental (Tc): Originates over North Africa. Warm, dry, and stable; brings summer heatwaves, dry air, and high daytime temperatures.
The Jet Stream and the Lifecycle of a Depression
The polar front jet stream is a narrow ribbon of fast, high-altitude westerly wind (flowing at 200 to 400 km/h) located near the tropopause (9 to 12 km altitude) directly above the Polar Front. It forms due to the steep horizontal temperature contrast between polar and tropical air masses.
- The jet stream steers Atlantic depressions from west to east at speeds of 40 to 60 km/h, making Irish weather highly changeable.
- Divergence of air aloft in the jet stream draws air upward from the surface, lowering surface pressure and enabling depressions to deepen.
- A mid-latitude depression forms along the Polar Front (50°N to 60°N) where warm Tropical Maritime (Tm) air meets cold Polar Maritime (Pm) air:
- Embryonic Stage: Surface friction and upper-level jet stream divergence trigger a wave or indentation along the polar front.
- Mature Stage: Surface pressure falls below 1,000 hPa. Winds spiral inward anticlockwise (due to the Coriolis effect). A leading warm front forms where warm Tm air glides up over cold air at a gentle slope of roughly 1:150. A trailing cold front forms where dense Pm air undercuts the warm sector at a steeper slope of roughly 1:50.
- Occluded Stage: The cold front travels faster (40 to 50 km/h) than the warm front (30 km/h). It overtakes the warm front, lifting the warm sector off the ground to form an occluded front. The depression loses its supply of warm surface moisture, central pressure rises, and the system dissipates.
Structure and Cross-Section of a Mature Depression
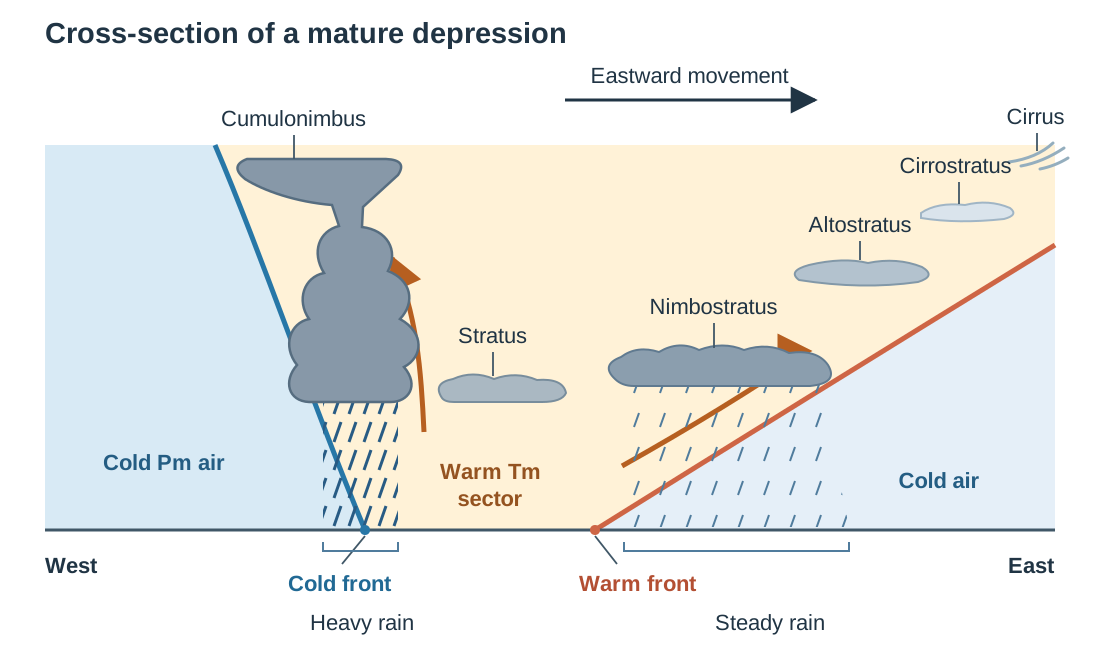
In a vertical cross-section from west to east through a mature depression:
- Ahead of the warm front to the east, cold polar air rests at the surface. Warm Tm air glides gently upward over this cold wedge. Cloud types transition with decreasing altitude: high cirrus gives way to cirrostratus, then altostratus, and finally a broad belt of thick nimbostratus that produces a wide zone of continuous, steady rain.
- In the warm sector behind the warm front, mild Tm air touches the surface, producing low stratus clouds, hill fog, and patchy drizzle.
- At the cold front to the west, dense Pm air wedges forcefully under the warm sector. This steep uplift forces rapid condensation into towering cumulonimbus clouds, generating a narrower belt of heavy rain, squally winds, and hail.
- Behind the cold front, cold Pm air occupies the surface, bringing clear skies and scattered cumulus clouds.
The Four-Stage Weather Sequence Across Ireland
Approach of Warm Front  -->  Warm Sector Passage  -->  Cold Front Passage  -->  Behind Cold Front
- Cirrus -> Nimbostratus     - Low Stratus cloud      - Towering Cumulonimbus  - Cumulus / Clear sky
- Pressure drops steadily    - Pressure steady & low  - Pressure jumps sharply - Pressure rises high
- Wind backs to SSE          - Wind veers to SW       - Wind veers to W/NW     - Wind steady NW
- Continuous, steady rain - Mild drizzle or mist - Violent squalls & hail - Cold polar showers- Warm Front Approaches: Upper-level cirrus thickens into cirrostratus (solar halo), lower altostratus, and dark nimbostratus. Barometric pressure drops steadily. Winds strengthen and back (turn anticlockwise) from south-westerly to south-southeasterly. Steady, prolonged rain begins.
- Warm Sector: Rain eases to drizzle or hill fog. Temperatures rise by 3°C to 6°C as humid tropical air covers the ground. Barometric pressure steadies at its lowest reading, and winds veer (turn clockwise) to blow from the south-west.
- Cold Front Passage: Cold polar air undercuts the warm air. Massive cumulonimbus towers produce torrential downpours, squalls, hail, and occasional thunder. Temperatures drop sharply, barometric pressure rises abruptly, and winds veer to the west-northwest.
- Behind the Cold Front: Cool, dry Polar Maritime air takes over. Barometric pressure rises steadily, winds blow from the north-west, and skies clear into bright sunshine broken by scattered cumulus showers.
Severe Atlantic depressions bring damaging weather events to Ireland. During Storm Ashley (20 October 2024), an intense Atlantic depression triggered status orange wind warnings, coastal gusts exceeding 130 km/h, coastal flooding, and widespread electrical power cuts across western and north-western counties.
Anticyclones and Blocking Highs
An anticyclone is a large system of high barometric pressure (typically 1020 to 1035 hPa) with subsiding air. As air sinks, it compresses and warms adiabatically, dropping relative humidity and evaporating clouds. Isobars are widely spaced, indicating a weak pressure gradient and light winds that blow clockwise and outward in the Northern Hemisphere.
- Summer Anticyclones: Clear skies allow intense solar heating, generating heatwaves with temperatures above 25°C to 30°C. Prolonged dry spells can trigger agricultural drought and municipal water restrictions.
- Winter Anticyclones: Clear night skies allow rapid terrestrial longwave radiation loss. The ground chills the bottom layer of air, creating a temperature inversion where cold surface air is trapped beneath warmer air aloft. This produces hard frosts, black ice, and stubborn radiation fog.
- Blocking Anticyclones: When the polar front jet stream meanders into high-amplitude loops, a massive, stationary anticyclone can lock in place over north-western Europe, diverting Atlantic depressions around Ireland for weeks. This produces extended dry spells, such as the severe summer heatwave and national hosepipe ban of 2018.
5. Local Wind Systems and Thunderstorms
Mesoscale and local weather systems develop from localized differential heating between contrasting physical surfaces.
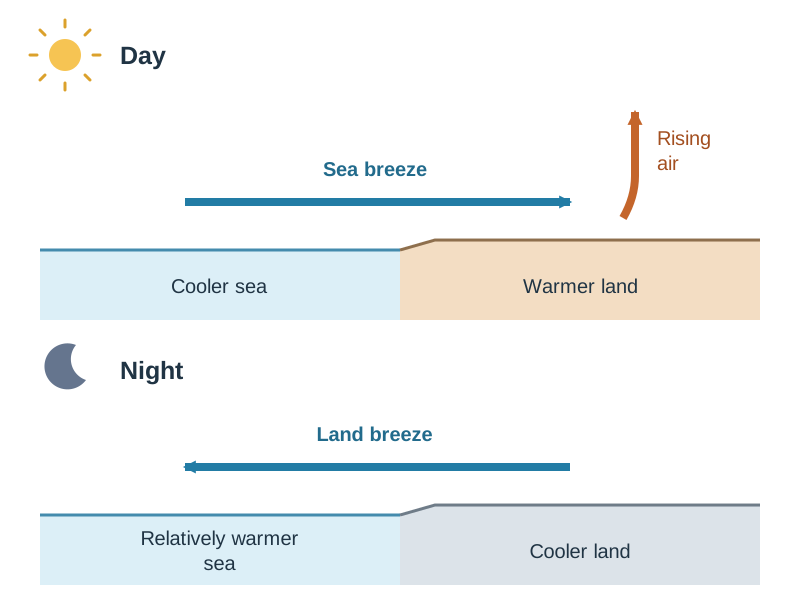
Land and Sea Breezes
Land and water surfaces possess different thermal properties: dry soil and rock have a low specific heat capacity (heating and cooling rapidly), while water has a high specific heat capacity and transparency (heating and cooling slowly).
- Daytime Sea Breeze: Under strong sunshine, the coastal land heats rapidly, warming the air above by conduction. The warm air expands, becomes less dense, and ascends, creating a localised thermal low-pressure area over land. Denser, cooler air overlying the sea flows onshore to replace it. This onshore sea breeze typically peaks by mid-afternoon, lowering coastal temperatures by several degrees along beaches such as Tramore, Co. Waterford, or Bray, Co. Wicklow.
- Night-time Land Breeze: Overnight, the land loses heat rapidly by terrestrial radiation, while the sea remains relatively warm. A shallow high-pressure cell develops over the chilled land, causing a gentle offshore land breeze to blow from the land out to sea.
Mountain and Valley Winds
Topography directly channels local air movements:
- Anabatic (Valley) Winds: During clear daylight hours, sunlight directly warms mountain slopes. Air in contact with the valley sides warms faster than free air at the same elevation over the valley centre. This buoyant, heated air ascends the valley walls as an upslope anabatic wind, frequently generating convective cumulus clouds above mountain ridges by early afternoon.
- Katabatic (Mountain) Winds: At night, high mountain plateaus and ridges radiate heat rapidly into space. The chilled, dense air slides downhill under gravity as a downslope katabatic wind, pooling in low valley floors. This cold drainage creates frost hollows where valley bottoms experience freezing temperatures and radiation fog while the surrounding upper slopes remain milder, a pattern common in sheltered Wicklow valleys like Glendalough.
Thunderstorm Formation
Thunderstorms develop within deep, unstable cumulonimbus clouds through three distinct developmental stages:
- Cumulus (Developing) Stage: Strong solar ground heating or frontal undercutting triggers rapid convective updrafts. Moist air rises, cooling adiabatically and releasing latent heat of condensation, which fuels vertical cloud growth through the troposphere.
- Mature Stage: The cloud top reaches the tropopause (10 to 12 km), spreading into an icy, glaciated anvil top. Heavy rain and hail drag cold air downward, establishing powerful downdrafts alongside the updrafts. Violent friction between rising ice crystals and falling soft hail (graupel) strips electrons, creating intense charge separation (positive charges at the top; negative charges at the base). When this electrical imbalance overcomes atmospheric resistance, a massive electrostatic discharge occurs as lightning. The lightning stroke instantly heats the air channel to roughly 30,000°C, causing an explosive expansion that creates the acoustic shockwave known as thunder.
- Dissipating Stage: Cold downdrafts spread across the base of the cloud, cutting off the supply of warm, moist surface updrafts. Without buoyant heat input, precipitation diminishes and the storm dissipates within one to two hours.
6. Ocean Circulation: Surface Gyres and the Thermohaline Conveyor
The world's oceans redistribute roughly 20% to 25% of the planet's surplus heat through two interconnected circulation systems.
Wind-Driven Surface Gyres
Surface currents are driven across the upper 100 to 200 m of the ocean by the frictional drag of prevailing winds, guided by continental coastlines and turned by the Coriolis effect into giant circular oceanic loops called gyres.
- In the North Atlantic, the clockwise subtropical gyre is pushed westward by the Trade Winds, funnelling warm equatorial water into the Caribbean Sea and Gulf of Mexico.
- This heated water exits through the Florida Straits as the fast, narrow Gulf Stream.
- Steered across the open Atlantic by the prevailing South-Westerlies, it becomes the broader, slower North Atlantic Drift.
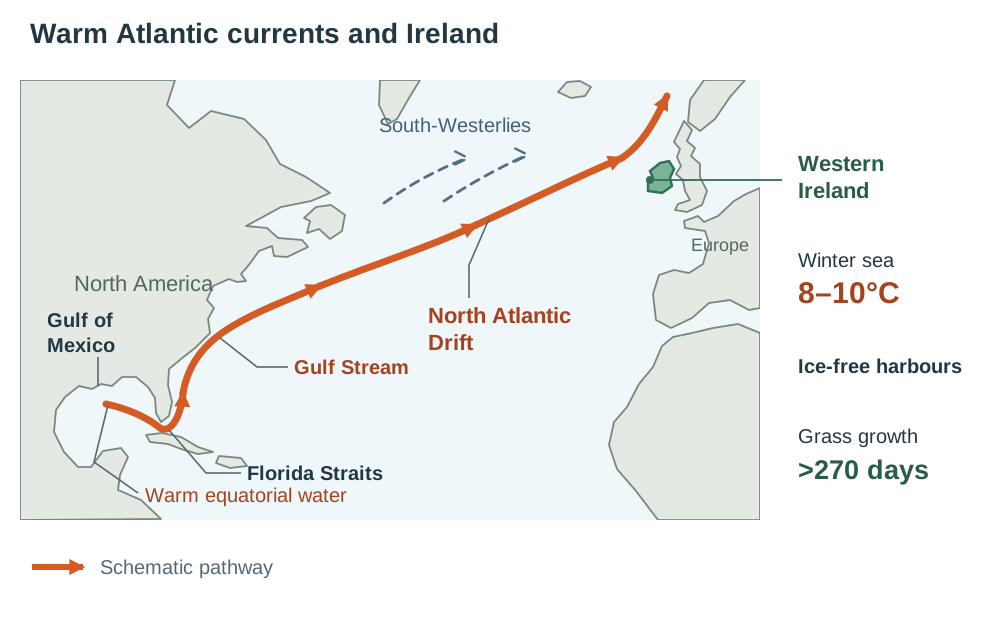
The North Atlantic Drift bathes Ireland and north-western Europe in water that is approximately 8°C to 10°C in mid-winter—about 7°C to 9°C above the global average for latitudes 50°N to 55°N. Consequently, Irish commercial ports remain ice-free year-round, and lowland snow cover is rare.
Thermohaline Circulation (The Global Conveyor Belt)
Deep ocean currents are driven by differences in water density, controlled by water temperature (thermo) and salinity (haline):
- In the subpolar North Atlantic near Greenland and Iceland, surface waters delivered by the North Atlantic Drift cool under freezing Arctic winds.
- When sea ice forms, salt is excluded from the freezing ice and expelled into the surrounding unfrozen water (brine rejection), raising its salinity.
- This water becomes cold, dense, and saline, causing it to sink to the ocean floor in a downwelling process that generates the North Atlantic Deep Water (NADW).
- The NADW creeps southward along the Atlantic seafloor, circles Antarctica, and branches into the Indian and Pacific Oceans.
- Over centuries (an estimated 1,000-year cycle), this deep water gradually warms, mixes, upwells back to the surface, and returns via surface currents to the North Atlantic.
Accelerated melting of the Greenland ice sheet and Arctic sea ice discharges vast quantities of low-density freshwater into the subpolar North Atlantic. This dilution reduces surface water salinity and density, which threatens to slow the sinking rate that drives the North Atlantic conveyor.
7. Synoptic Weather Charts and Satellite Remote Sensing
Interpreting meteorological charts and satellite data is a core geographical skill examined in Part One short questions, in the data and map elements of Part Two questions, and in the geographical investigation report.
Synoptic Weather Chart Analysis
A synoptic chart plots simultaneous meteorological observations from land stations and marine buoys using standardised symbols and isolines:
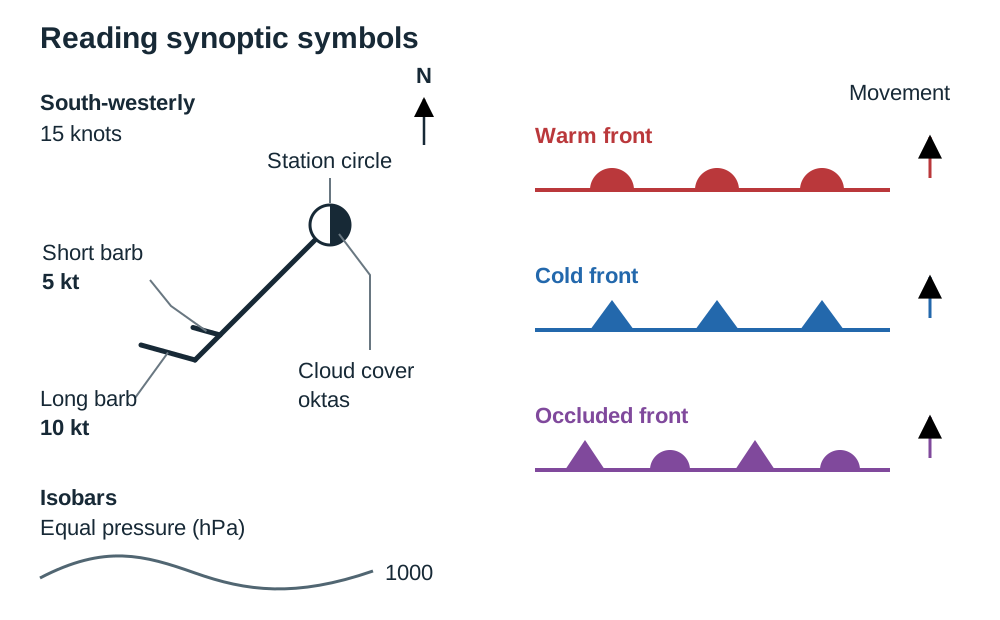
- Isobars: Lines joining places of equal atmospheric pressure. The interval is usually 4 hPa on Met Éireann surface analysis charts (e.g., 996, 1000, 1004 hPa), but candidates should always read two adjacent labelled isobars to confirm the contour interval. Closely spaced isobars indicate a steep pressure gradient and strong gale-force winds. Widely spaced isobars indicate a gentle pressure gradient and light breezes or calm air.
- Pressure Centres: Low-pressure centres are marked with L (depressions; ascending air, cloudy, unsettled, rainy weather). High-pressure centres are marked with H (anticyclones; descending air, dry, settled conditions).
- Frontal Lines:
- Warm Front: Solid line with semicircles pointing in the direction of movement (red on coloured charts).
- Cold Front: Solid line with triangles pointing in the direction of movement (blue on coloured charts).
- Occluded Front: Alternating semicircles and triangles along the same line (purple on coloured charts).
- Family of Isolines:
- Isobars: Lines of equal atmospheric pressure.
- Isotherms: Lines of equal air temperature.
- Isohyets: Lines of equal rainfall accumulation over a stated period.
- Isohels: Lines of equal sunshine duration over a stated period.
- Station Model Wind Barbs: On a station plot, the shaft extends outward from the station circle in the direction from which the wind blows. The feathers on the outer tail show wind speed in knots:
- Half feather = 5 knots (~9 km/h)
- Full feather = 10 knots (~19 km/h)
- Solid triangular flag (pennant) = 50 knots (~93 km/h)
- Shading inside the station circle indicates total cloud cover in oktas (eighths), from 0 (completely clear sky) to 8/8 (completely overcast).
Satellite Remote Sensing in Meteorology
Meteorological satellites orbiting the Earth provide continuous, wide-area atmospheric observations across three main sensor channels:
- Visible Satellite Imagery: Records reflected shortwave solar radiation, producing high-resolution photographic images of cloud patterns, sea ice, and snow cover. Its main limitation is that it operates only during daylight hours.
- Infrared (IR) Satellite Imagery: Measures longwave thermal infrared radiation emitted by cloud tops and Earth's surface. Cold objects appear bright white, while warm surfaces appear dark grey. Because tropospheric temperatures drop with height, high-altitude cumulonimbus cloud tops show up brilliant white, whereas low, warmer stratus clouds appear dull grey. Infrared sensors operate continuously, day and night.
- Water Vapour Imagery: Calibrated to detect radiation at wavelengths absorbed specifically by water vapour in the middle and upper troposphere (around 6.7 micrometres). It maps atmospheric moisture transport and highlights jet streams and circulation vortices even where visible clouds have not yet formed.
On satellite imagery, mid-latitude depressions display a characteristic comma-shaped cloud spiral, with a distinct leading band along the warm front and an active, dense squall line tracing the cold front.
8. Global Climates and Climate Change
The Earth is divided into distinctive climatic zones based on latitude, prevailing winds, and oceanic proximity. The characteristics of climate change over both space and time.
Cool Temperate Oceanic Climate (Cfb)
Ireland represents the classic Cool Temperate Oceanic Climate (Köppen Cfb), which also covers the Atlantic coastal fringe of north-western Europe (western Britain, north-western France, Belgium, the Netherlands, and western Norway).
- Temperature Regime: Characterised by mild winters (mean January temperatures of 4°C to 7°C) and cool summers (mean July temperatures of 14°C to 16°C). The annual temperature range is small (8°C to 10°C) due to Atlantic moderation. For example, Valentia Observatory records a January mean of 7°C and a July mean of 15°C (an annual range of 8°C). In contrast, Moscow, at a broadly similar latitude (about 56°N), has an annual range of 25°C (-6°C in January to 19°C in July).
- Precipitation Regime: Precipitation falls throughout the year, with a winter maximum driven by Atlantic depressions. Annual totals range from 750 mm to 800 mm in eastern lowlands (e.g., Dublin) to 1,200 mm to 1,500 mm in western lowlands (e.g., Galway), exceeding 2,500 mm on western mountain summits due to relief uplift.
- Sunshine and Winds: Annual sunshine ranges from 1,100 hours in the mountainous north-west to over 1,600 hours along the south-east coast (Co. Wexford). Prevailing winds blow consistently from the south-west.
Working with a Climograph
A climograph plots mean monthly temperature as a line graph (°C on the right-hand axis) and mean monthly precipitation as vertical bars (mm on the left-hand axis). To analyse a climograph in an exam:
- Identify the highest and lowest mean monthly temperatures and their months.
- Calculate the annual temperature range (maximum monthly temperature minus minimum monthly temperature).
- State total annual precipitation and note the wettest and driest months.
- Determine the distribution: is rainfall evenly spread throughout the year, or is there a distinct dry season?
- Identify the climate type and support your choice with one piece of data.
Natural Climate Change: Ice Ages and Milankovitch Cycles
Over the Quaternary Period (the past 2.6 million years), Earth has alternated between cold glacials (lasting roughly 100,000 years) and warmer interglacials (lasting 10,000 to 20,000 years). The current interglacial, the Holocene, began roughly 11,700 years ago.
These natural long-term fluctuations are driven by orbital variations in Earth's path around the sun, known as Milankovitch Cycles:
- Eccentricity (100,000-year cycle): Earth's orbit shifts between circular and elliptical, altering the distance to the sun and varying solar radiation received between perihelion and aphelion.
- Obliquity / Axial Tilt (41,000-year cycle): The tilt of Earth's rotational axis oscillates between 22.1° and 24.5° (currently 23.5°). A lower tilt reduces summer insolation at high latitudes, preventing winter snow from melting and allowing ice sheets to grow.
- Precession of the Equinoxes (23,000-year cycle): The Earth wobbles on its rotational axis like a spinning top, altering the calendar timing of perihelion.
When these cycles align to reduce summer sunshine in high northern latitudes, winter snow persists, building continental ice sheets that carved glacial features across Ireland, such as the U-shaped valley at Glendalough, Co. Wicklow.
Natural Climate Fluctuations: The El Niño Southern Oscillation (ENSO)
ENSO is a recurring ocean-atmosphere cycle across the equatorial Pacific operating every two to seven years:
- Normal Conditions: Strong easterly trade winds push warm surface water westward toward Indonesia, building a deep warm pool. This allows cold, nutrient-rich deep water to upwell along Peru (coastal upwelling), supporting abundant anchovy fisheries while keeping coastal South America arid.
- El Niño Conditions: Trade winds weaken or reverse. The warm surface pool surges eastward across the Pacific to South America, shutting down the Peruvian upwelling. Sea temperatures off Peru rise by up to 5°C, collapsing fish stocks and triggering torrential rains and mudslides along the arid coast. Meanwhile, sinking dry air over the western Pacific causes severe droughts and bushfires across Australia and Indonesia.
Human-Induced (Enhanced) Greenhouse Effect
Ice ages and El Niño show that climate changes naturally; however, the warming of the last century is different in speed and in cause. The enhanced greenhouse effect is the additional warming caused when human activities add extra greenhouse gases to the atmosphere, trapping more outgoing longwave terrestrial radiation. Global mean surface temperatures are now roughly 1.1°C to 1.3°C above the 1850–1900 pre-industrial baseline, and atmospheric has risen from 280 ppm to over 420 ppm.
Human Causes:
- Burning fossil fuels (coal, oil, natural gas, peat) for electricity, heating, and transport releases large volumes of carbon dioxide. Moneypoint power station in Co. Clare was historically Ireland's largest single coal-burning point source.
- Deforestation (e.g., clearing the Amazon basin for cattle ranching and soya) destroys vital carbon sinks and releases stored carbon when timber is burned.
- Agriculture releases methane () from enteric fermentation in cattle and sheep and nitrous oxide () from synthetic nitrogen fertilisers. Agriculture is Ireland's largest emitting sector, accounting for roughly 38% of national greenhouse gas emissions.
- Industrial processes, cement manufacturing, and landfill emissions add further greenhouse gases.
Evidence for Climate Change:
- Instrumental records: Met Éireann data show that Ireland's mean annual temperature has risen by roughly 1°C since 1900, with the warmest years on record clustered in the last two decades.
- Ice cores: Drilled ice cores from Antarctica and Greenland contain ancient trapped air bubbles proving that atmospheric and global temperatures have tracked closely together over 800,000 years.
- Glacial retreat and sea ice loss: Alpine glaciers are retreating globally, and Arctic September sea-ice extent has declined by approximately 13% per decade since satellite monitoring began in 1979.
- Sea-level rise: Global mean sea level is rising at roughly 3.3 mm per year due to thermal expansion of warming ocean water and melting land ice.
- Biological shifts: Phenological records show earlier spring leafing and nesting dates, and warm-water marine species such as mackerel are migrating northward in the north-east Atlantic.
Impacts on Ireland:
- Wetter, stormier winters and increased frequency of river and coastal flooding, placing urban centres like Cork city and low-lying Dublin suburbs (e.g., Clontarf) at recurring risk.
- Sea-level rise accelerating coastal erosion along soft boulder-clay coastlines, particularly in Counties Wexford (Rosslare) and Dublin (Portrane).
- Drier summer periods increasing stress on domestic water supplies in the Greater Dublin Area, raising the risk of summer water conservation orders.
- A longer grass-growing season benefits pastoral agriculture, but increased winter rainfall intensifies waterlogging and soil poaching on western gley soils, and invasive agricultural pests spread northward.
- A potential weakening of the North Atlantic Drift and thermohaline circulation could reduce the regional maritime warming Ireland currently enjoys.
Responses to Climate Change:
- International policy: The Paris Agreement (2015) legally commits signatories to keep global temperature rise well below 2°C above pre-industrial levels and pursue efforts to limit it to 1.5°C.
- National legislation: Ireland's Climate Action and Low Carbon Development (Amendment) Act 2021 sets legally binding targets to reduce national greenhouse gas emissions by 51% by 2030 and reach net-zero emissions by 2050.
- Energy transition: Expanding onshore and offshore wind generation, utility solar farms, and ending commercial peat-fired electricity generation at Lanesborough and Shannonbridge.
- Land use: State afforestation programs for carbon sequestration and the rewetting of drained raised bogs by Bord na Móna, transforming degraded peatlands from carbon sources back into long-term carbon sinks.
9. Climatic Impacts on Economic Development
Climate directly shapes primary production, resource security, and economic development.
Climate and Irish Agriculture
Ireland's cool temperate oceanic climate provides an exceptionally long grass-growing season exceeding 270 days per year in the south and south-west, compared to under 200 days in continental eastern Europe. Mild winter temperatures rarely kill perennial ryegrass, and abundant, reliable rainfall sustains continuous summer pasture growth.
This climatic advantage supports Ireland's export-oriented dairy and pastoral beef farming, concentrated across the fertile Munster dairy belt (Counties Cork, Tipperary, Limerick, and Kerry). However, excessive rainfall creates operational difficulties:
- In western counties (e.g., Leitrim, Mayo), annual rainfall exceeding 1,400 mm on poorly drained gley soils causes severe waterlogging and soil poaching (destruction of grass sod by livestock hooves).
- Cattle must be housed indoors in slatted sheds for up to five months during winter, requiring capital investment in winter silage storage and slurry storage tanks to prevent water pollution.
- Tillage farming (malting barley, wheat, oats) requires dry seedbeds in spring and sunshine for summer ripening and autumn harvesting; commercial arable farming is therefore concentrated in the drier, sunnier south-east (Counties Wexford, Carlow, and Kildare).
Precipitation and Municipal Water Supplies
Rainfall distribution and population density in Ireland are in sharp geographical conflict:
- The Greater Dublin Area receives the lowest annual rainfall in the country (roughly 750 mm to 800 mm), yet houses over 1.5 million people alongside water-intensive pharmaceutical, chemical, and technology industries.
- Dublin's municipal supply depends on the Poulaphouca Reservoir (Blessington Lakes, River Liffey, Co. Wicklow) and the Vartry Reservoir (Roundwood, Co. Wicklow). During extended summer anticyclones (such as 2018), municipal demand exceeds treatment and storage capacities, forcing Irish Water to introduce regional hosepipe bans.
- By contrast, western mountainous catchments receive surplus rainfall (>2,000 mm) but have low population densities.
Drought and Desertification in the African Sahel
The Sahel is a fragile, semi-arid transition zone spanning 5,000 km across North Africa south of the Sahara, passing through Senegal, Mali, Burkina Faso, Niger, Chad, and Sudan. It has a single, erratic wet season between June and September governed by the northward migration of the ITCZ, delivering only 200 mm to 600 mm of rain annually.
Desertification—the persistent degradation of dryland ecosystems into barren land—results from linked climatic and human pressures:
- Climatic Triggers: Fluctuations in Atlantic sea-surface temperatures weaken the summer monsoon, triggering prolonged, severe droughts, as experienced throughout the 1970s and 1980s. Dry, dusty harmattan winds blowing from the Sahara accelerate evapotranspiration.
- Human Pressures: Rapid population growth drives overcultivation of marginal land without fallow periods, depleting soil organic matter. Pastoral herds are expanded beyond the carrying capacity of sparse grassland, causing severe overgrazing. Acacia trees are cleared for domestic firewood and charcoal.
- Physical Impacts: Without plant cover, torrential rainstorms and strong winds wash and blow topsoil away. Raindrop impact on bare, structureless soil causes surface crusting or sealing (capping), forming a hard crust that prevents rainwater from infiltrating and increases runoff. The exposed, pale soil increases surface albedo, which reflects more solar radiation, suppresses local convective cloud formation, and reinforces the drought.
- Socio-Economic Impacts: Cereal crop failures (sorghum and millet), widespread starvation of livestock, famine, and the displacement of environmental refugees into overcrowded urban centres like Niamey and Khartoum. Dwindling water and grazing land have sparked violent resource conflicts between settled crop farmers and nomadic Fulani pastoralists.
- Sustainable Responses: The African Union's Great Green Wall initiative is planting an 8,000 km belt of drought-hardy acacia trees across the southern Sahel margin to anchor topsoil, fix nitrogen, and halt dune migration. Local communities in Burkina Faso and Niger construct stone bunds (diguettes) along slope contours to slow runoff, trap sediment, and encourage rainwater infiltration, which raises crop yields by up to 50%. Farmers also practice Farmer-Managed Natural Regeneration (FMNR), pruning and protecting native tree root systems already present in crop fields.
Climate and Global Tourism
Climate is a primary driver of the international tourism industry:
- Mediterranean Basin: Reliable summer anticyclones deliver hot, dry, sunny weather (28°C to 35°C) and warm sea temperatures, attracting over 300 million tourists annually to Spain, Italy, and Greece. However, severe summer heatwaves, wildfires, and water shortages are increasingly challenging peak-season operations.
- Ireland: While unpredictable frontal rainfall limits traditional beach tourism, Ireland's mild climate supports year-round active outdoor tourism—such as golfing, hillwalking, and driving routes like the Wild Atlantic Way—without extreme summer heat or prolonged sub-zero winter freezes.
Key terms
- Insolation
- Incoming solar radiation received by the Earth's atmosphere and surface from the sun, measured in watts per square metre.
- Albedo
- The fraction or percentage of incoming solar radiation reflected back into space by a surface without being absorbed.
- Relative Humidity
- The amount of water vapour present in an air parcel expressed as a percentage of the maximum capacity it can hold at that specific temperature.
- Adiabatic Cooling
- The drop in temperature that occurs when an ascending air parcel expands under lower surrounding atmospheric pressure without exchanging heat with surrounding air.
- Dew Point
- The temperature to which an air parcel must cool for its relative humidity to reach 100% and condensation to begin.
- Coriolis Effect
- The apparent deflection of moving air and water caused by Earth's rotation, turning parcels to the right in the Northern Hemisphere and to the left in the Southern Hemisphere.
- Polar Front Jet Stream
- A narrow ribbon of fast, high-altitude westerly wind near the tropopause that steers mid-latitude depressions and drives surface pressure changes.
- Depression
- A dynamic low-pressure weather system with ascending air, inward anticlockwise winds in the Northern Hemisphere, fronts, and unsettled precipitation.
- Anticyclone
- A large high-pressure weather system characterized by subsiding air, wide isobar spacing, light clockwise winds in the Northern Hemisphere, and settled weather.
- Occluded Front
- A weather front formed when a faster-moving cold front overtakes a warm front, undercutting it and lifting the warm sector completely off the ground.
- North Atlantic Drift
- A warm surface ocean current propelled north-eastward across the Atlantic by the prevailing South-Westerlies, keeping north-western European winter temperatures mild.
- Thermohaline Circulation
- The global, deep-ocean conveyor circulation driven by density differences that arise from variations in water temperature (thermo) and salinity (haline).
- Milankovitch Cycles
- Cyclical variations in Earth's orbit (eccentricity, axial tilt, and precession) that alter the spatial distribution of insolation and drive glacial-interglacial cycles.
- El Niño
- The periodic warming of equatorial eastern Pacific surface waters caused by weakening trade winds, which disrupts global weather patterns and suppresses Peruvian upwelling.
- Enhanced Greenhouse Effect
- The additional warming of Earth's atmosphere caused by human emissions of greenhouse gases trapping extra outgoing longwave infrared radiation.
- Isobar
- A line drawn on a synoptic weather chart connecting places of equal barometric atmospheric pressure, calibrated in hectopascals (hPa) or millibars (mb).
- Isohyet
- A line drawn on a climatological map connecting geographical locations that receive equal amounts of precipitation over a specified period.
- Isohel
- A line drawn on a climatological map connecting geographical locations that receive equal durations of bright sunshine.
- Isotherm
- A line drawn on a weather map connecting points of equal air temperature.
- Desertification
- The persistent degradation of dryland ecosystems in arid, semi-arid, and dry sub-humid areas resulting from climatic variations and unsustainable human activities.
Check yourself
What happens to the relative humidity of an air parcel if it cools without any change in its actual water vapour content?
Relative humidity increases because cooler air has a smaller saturation water vapour capacity.
Why do closely spaced isobars on a synoptic weather chart indicate strong winds?
Closely spaced isobars indicate a steep atmospheric pressure gradient, meaning air is driven rapidly from high to low pressure across a short horizontal distance.
Explain why Dublin receives roughly 750 mm of annual rainfall while parts of western Kerry receive over 2,500 mm.
Prevailing moist south-westerly winds are forced to rise over western mountain ranges like MacGillycuddy's Reeks, cooling adiabatically and dropping heavy relief rainfall on windward slopes. As the air descends the eastern leeward slopes, it warms and dries, placing Dublin in a rain shadow.
What is the key operational advantage of infrared satellite imagery over visible satellite imagery?
Infrared imagery measures thermal infrared radiation emitted by cloud tops and the Earth's surface, allowing it to operate continuously 24 hours a day (both day and night), whereas visible imagery relies on reflected sunlight and functions only during daylight hours.
In the Sahel, removal of tree cover reduces two transfers in the hydrological cycle. Which two transfers fall, and why does this worsen drought?
Transpiration and infiltration fall. Fewer leaves reduce water vapour returned to the air, suppressing local convective cloud formation; lack of root channels and organic matter causes surface crusting, preventing rainwater from recharging groundwater aquifers.
A synoptic station plot shows a shaft pointing from the station circle towards the south-west, carrying one full feather and one half feather. Give the wind direction and speed.
South-westerly wind at 15 knots (one full feather = 10 knots, one half feather = 5 knots).
Which air mass is responsible for cool, bright, breezy weather with scattered showers and hail across Ireland in April?
Polar Maritime (Pm), which originates over the cold North Atlantic and becomes unstable and moist in its lower layers as it moves southward.
Name two major reservoirs that provide domestic drinking water for the Greater Dublin Area.
The Poulaphouca Reservoir (Blessington Lakes on the River Liffey) and the Vartry Reservoir (Roundwood), both situated in County Wicklow.