

Tables, graphs, and visual figures form a central part of the Leaving Certificate Geography examination. They appear in Part One (the Short Questions) and as the compulsory stimulus material in Part A of the Part Two questions on the Physical Environment, Regional Geography, and the Electives. In Part Two, each full question is worth 80 marks: Part A is worth 20 marks and consists of short sub-parts worth 2 or 4 marks each, followed by 60 marks of developed questions. Part A is compulsory once you choose that question. Visual data also features prominently in Core Unit 3 (The Geographical Investigation), which accounts for 20% of your total examination grade. At Higher Level, you are assessed on your ability to analyse and evaluate numerical and graphical information rather than merely copying down numbers. You must extract values accurately, perform key calculations, spot spatial and temporal trends, and explain the real-world processes behind the data using significant relevant points.
Exam Structure and the Part A Routine
Figure-based questions appear in two distinct areas of the terminal examination paper.
Part One: Short Questions
Part One consists of twelve short questions, from which you answer ten. Each question carries 8 marks, typically divided into four sub-parts worth 2 marks each. Many of these questions are built around a single stimulus, such as a table of census data, an earthquake distribution map, a pie chart, or a simple diagram.
Three practical rules apply to Part One:
- Write the answer only. There are no marks awarded for working or extended narrative in Part One, so an accurate figure, name, or tick is all that is required.
- Spend no more than two minutes on each short question. Part One carries 80 marks in total—the same weight as an entire Part Two question—so managing your time here protects the rest of your paper.
- Never leave a blank. A blank is an immediate zero, whereas an informed estimate or read-off from a chart often secures full marks.
Part Two: The Part A Stimulus Structure
In Part Two, each 80-mark multi-part question opens with a 20-mark stimulus section (Part A). These sub-questions follow a reliable three-tier progression:
- Direct Data Extraction (usually 2 marks): Stating a single figure, date, or named category directly from the stimulus.
- Calculation (usually 4 marks): Working out an absolute difference, finding a percentage share, calculating an unknown value (such as X), or calculating a demographic rate. Examiners look for the correct figure. Setting out the formula and substitution makes arithmetic slips easy to spot and can attract partial credit if available.
- Geographical Explanation (usually 4 marks): Explaining the physical, economic, or social reasons behind the pattern. A 4-mark 'explain briefly' sub-question is normally marked on two significant relevant points (SRPs): 2 marks for naming the geographical factor and 2 marks for developing it. Write two complete sentences rather than an extended paragraph; extra sentences beyond the two required points earn no additional credit.
| Command Word | What the Examiner Expects | Practical Exam Technique |
|---|---|---|
| Read-off / State | A single value, date, or category taken directly from the figure. | Include the unit or scale with the figure, such as €694 million, 15 metres, or 53%. |
| Identify | The highest, lowest, or named category satisfying a given condition. | Scan all columns or bars; check whether the prompt specifies a particular year or region. |
| Calculate | A numerical answer requiring arithmetic work. | State your formula, substituted numbers, final figure, and units. |
| Compare | A direct contrast between two or more categories or time periods. | State both figures, calculate the difference, and link them using comparative words like whereas or higher than. |
| Explain briefly | Real-world geographical causes, consequences, or policy challenges. | Provide two full sentences: one naming the factor, one developing it with a concrete consequence or named place. |
The 8-Minute Part A Routine
When tackling a 20-mark Part A, stick to a disciplined routine to stay within an 8-minute target:
- Read the title, key, axis labels, units, and any scale multiplier before examining the numbers.
- Note the exact year, region, or category specified in each sub-part.
- Answer the direct read-offs first to secure the initial marks quickly.
- Set out calculations with formula, substitution, final answer, and unit.
- Answer explanatory sub-questions with two focused sentences containing a named place, policy, or figure.
Specialised Part A Formats and Graph Reading
Beyond standard read-offs and calculations, three specific question formats recur regularly across stimulus questions.
True or False Sub-Questions
When asked to indicate whether a statement is true or false, write only the word 'True' or 'False'. Do not add unnecessary explanation unless explicitly asked, and never write both.
Multiple Choice and Pick-One Estimations
Prompts asking you to choose one option from three (for example, whether an older population share is '11% or 15% or 19%') are often worth 4 marks. Rather than guessing, perform the necessary arithmetic. On a population pyramid, add the male and female percentages for each cohort aged 65 and over (65–69, 70–74, 75–79, 80–84, 85+) and select the option closest to your calculated total. Never leave a choice question blank.
Providing Evidence from the Stimulus
When a question asks you to provide one piece of evidence from a graph or table (for instance, showing whether males or females live longer), examiners do not award marks for vague impressions. Your answer must follow a three-part structure: figure + category + comparison.
- Weak response (earns zero): 'You can see that the female side is wider at the top.'
- Strong response (earns full marks): 'In the 85 and over cohort, females account for approximately 1.2% of the population compared to 0.7% for males, meaning the female horizontal bar is visibly longer.'
Reading Between Gridlines and Rounding
Data points on line graphs and population pyramids frequently sit between marked gridlines. To read these accurately, calculate the value of one division: Value of one division = (Upper gridline value − Lower gridline value) ÷ Number of increments between them
For example, if an axis runs from 20 to 30 with five small divisions between them, each division represents (30 − 20) ÷ 5 = 2 units. A bar extending two-and-a-half divisions above 20 is read as 20 + (2.5 × 2) = 25.
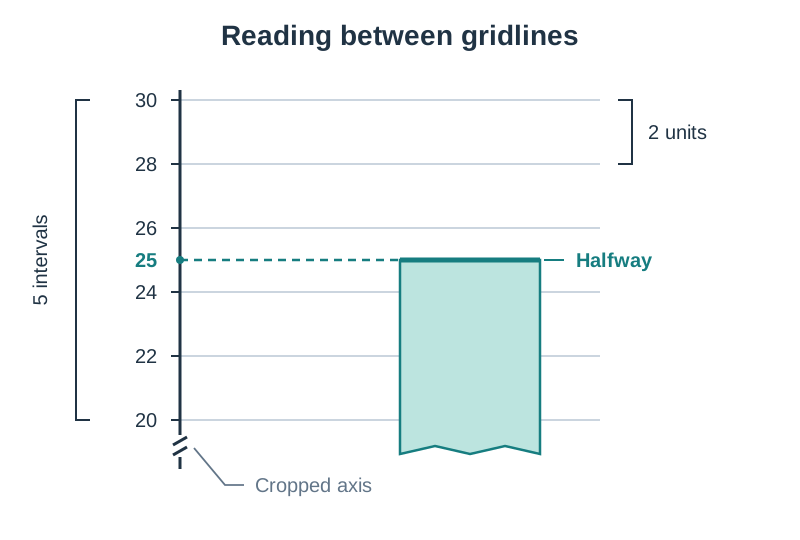
Marking schemes typically allow a narrow tolerance around the exact value. Follow any explicit rounding instructions (such as 'to the nearest whole number'). If no instruction is given, match the decimal precision shown in the rest of the table or graph.
Continuous Data: Line Graphs, Climate Graphs, and Scatter Plots
Continuous data represents numerical values along an unbroken numerical scale, such as temperature, river velocity, altitude, or time.
Line Graphs
Line graphs show changes over time or continuous changes along a transect. The horizontal X-axis represents the independent variable (such as months, years, or distance downstream), while the vertical Y-axis carries the dependent variable (such as river discharge or population). When describing a line graph, apply a four-part check: state the general trend (rising, falling, or fluctuating); quote the start and end values with their units; identify the period of steepest change; and note any anomaly or sudden turning point.
Climate Graphs
Climate graphs combine two distinct graph formats into a single diagram with dual vertical axes. Mean monthly temperature is shown as a continuous line (usually red) with its scale in degrees Celsius (°C) on one axis. Monthly precipitation is shown as vertical bars (usually blue) with its scale in millimetres (mm) on the opposite vertical axis.
Two calculations frequently appear on climate graphs:
- Annual temperature range = Warmest monthly temperature (°C) − Coldest monthly temperature (°C)
- Total annual precipitation = add the twelve monthly rainfall figures together (answer in mm)
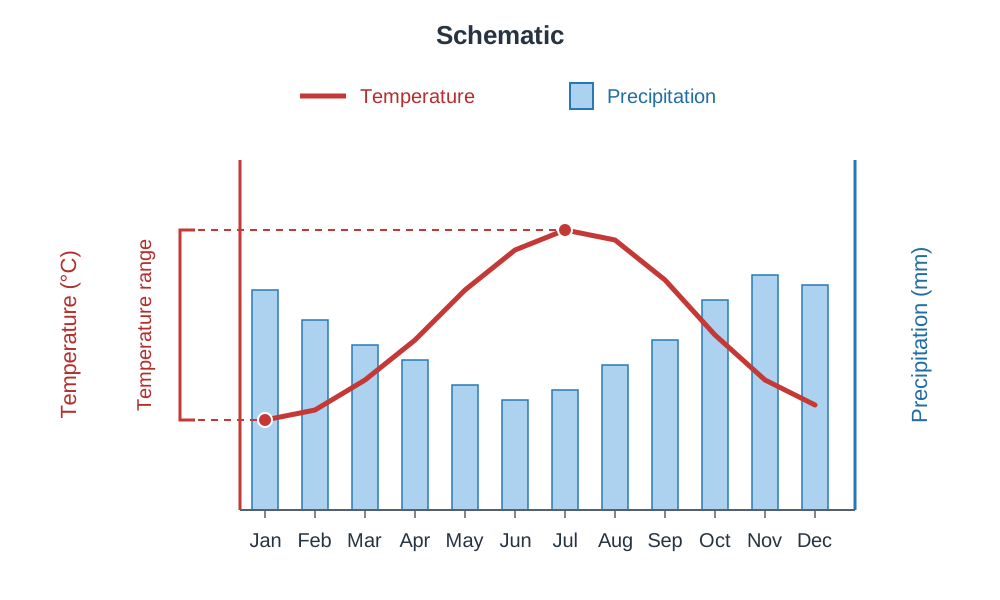
Irish weather stations in western maritime locations (such as Valentia, Co. Kerry) show low annual temperature ranges (typically 8°C to 10°C) and high annual precipitation (often exceeding 1,200 mm) due to the moderating influence of the Atlantic Ocean and prevailing south-westerly winds.
Scatter Graphs
A scatter graph uses Cartesian coordinates to display paired measurements and determine whether a relationship exists between two variables.
- A positive correlation shows points sloping upwards from bottom-left to top-right, meaning that as one variable increases, the other also increases. In development studies, Gross National Income (GNI) per capita displays a strong positive correlation with life expectancy.
- A negative correlation shows points sloping downwards from top-left to bottom-right, meaning that as one variable increases, the other decreases. Examples include river bedload pebble size against distance downstream (due to attrition), or agricultural land values against distance from a central business district (CBD).
- Zero correlation shows scattered, random points with no distinct line of best fit. Remember that correlation indicates an association between variables, but does not prove direct physical or economic causation.
Discrete and Proportional Figures: Bar Charts, Pie Charts, and Maps
Discrete and categorical data deal with separate groups, such as economic sectors, administrative counties, or distinct land-use zones.
Bar Charts (Single, Comparative, and Divided)
Bars must be drawn with equal width and clear spaces between separate categories. Single bar charts show one variable across groups; comparative bar charts place two or more bars side by side for each category (such as comparing 2011 and 2016 census figures across counties).
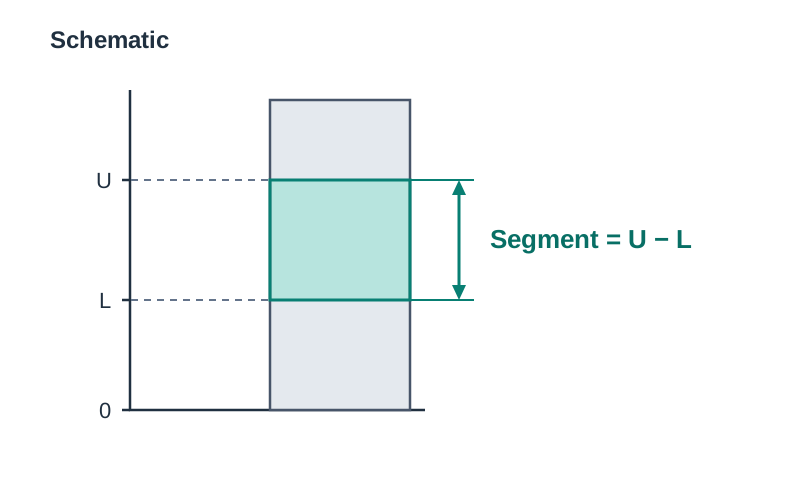
In a divided (stacked) bar chart, each bar represents a total figure divided into proportional segments. To read any internal segment, you must subtract the lower baseline value from the upper boundary value: Segment value = Upper line reading − Lower line reading. Never read the value of an internal segment directly off the vertical axis without subtracting the baseline.
Pie Charts
Pie charts show how a single total is divided up—the entire circle represents 100% or 360°. When one slice is marked X, find the missing value by subtracting the known slices from 100: Missing percentage (X) = 100% − (sum of all given sector percentages)
To convert between percentages and circle degrees:
- Angle in degrees = Percentage share × 3.6
- Percentage share = (Angle in degrees ÷ 360) × 100
Proportional Symbols and Flow Lines
On map stimuli, proportional symbols (most commonly circles) scale the visual area of the symbol in proportion to the quantity being represented at that location, such as urban population sizes. Flow lines use arrows to show movement between regions (such as daily commuter flows or international migration patterns), where the width of the line reflects the volume of the flow.
The Geographical Calculation Toolkit
Numerical sub-questions in Part A require clear, step-by-step arithmetic.
Percentage Share
Percentage share = (Category value ÷ Total value) × 100
Always ensure the denominator matches the exact wording of the question. For example, if asked for the seafood sector's share of total coastal employment, divide by total coastal employment rather than total coastal population.
Percentage Point Difference vs Relative Percentage Change
This is one of the most critical distinctions on the examination paper. When comparing two figures that are already given as percentages, the difference is calculated by direct subtraction and expressed in percentage points: Percentage point difference = Second percentage − First percentage
For example, if wind energy increases from 12% of total electricity generation to 25%, the increase is 13 percentage points (25 − 12 = 13). Only if the question explicitly asks for the relative percentage change from the original baseline do you use the formula: ((New value − Original value) ÷ Original value) × 100. For the wind energy example, that calculation would be ((25 − 12) ÷ 12) × 100 = 108.3%.
Absolute Differences in Raw and Index Data
Absolute difference = Larger value − Smaller value
When calculating differences in decimal indices, such as the Human Development Index (HDI):
- Maintain the exact number of decimal places shown in the source table (for example, Brazil 0.759 − Sierra Leone 0.419 = 0.340).
- Do not add percentage signs or units to index figures. The HDI is a composite unitless scale running from 0 to 1 based on life expectancy, mean and expected years of schooling, and GNI per capita.
- If figures are stated in thousands or € millions, attach the full multiplier or write out the complete number (for example, 75,000 − 36,139 = 38,861 workers).
Finding a Value Behind a Percentage
Value = (Percentage ÷ 100) × Total
For example, if a Gaeltacht town has a population of 400 and 73% are daily Irish speakers: Value = (73 ÷ 100) × 400 = 0.73 × 400 = 292 daily Irish speakers. Always verify whether the question asks for the percentage or the absolute number of people.
Filling a Gap in a Column Total
Missing value = Total − (sum of all given values)
If total regional employment is 36,139 and four identified sectors account for 34,901, the remaining sector accounts for 36,139 − 34,901 = 1,238 workers.
Statistical Averages and Measures
- Mean (average) = Sum of all values ÷ Total number of values
- Median = The middle value when all numbers are arranged in ascending order (if the count is even, take the mean of the two middle values)
- Mode = The value appearing most frequently in the dataset
- Range = Highest value − Lowest value
For example, five beach pebbles have long-axis lengths of 4 cm, 6 cm, 7 cm, 9 cm, and 9 cm: Mean = (4 + 6 + 7 + 9 + 9) ÷ 5 = 35 ÷ 5 = 7 cm; Median = 7 cm; Mode = 9 cm; Range = 9 − 4 = 5 cm.
Demographic Figures and Census Data
Demographic trends are examined through national census returns and population pyramids.
Core Census Calculations
- Birth rate = (Annual births ÷ Total population) × 1,000 (expressed as births per 1,000 people per year)
- Death rate = (Annual deaths ÷ Total population) × 1,000 (expressed as deaths per 1,000 people per year)
- Natural increase = Annual births − Annual deaths (or Birth rate − Death rate)
- Net migration = Immigrants arriving − Emigrants leaving (a negative result indicates net out-migration)
- Overall population change = Natural increase + Net migration
- Population density = Total population ÷ Total land area (expressed as people per km²)
Examiners frequently set questions highlighting that a region can have a positive natural increase yet still experience population decline if net out-migration exceeds that natural growth. This is a common pattern in peripheral western Irish counties, where young adults leave to pursue higher education or work in Dublin and overseas.
Population Pyramids
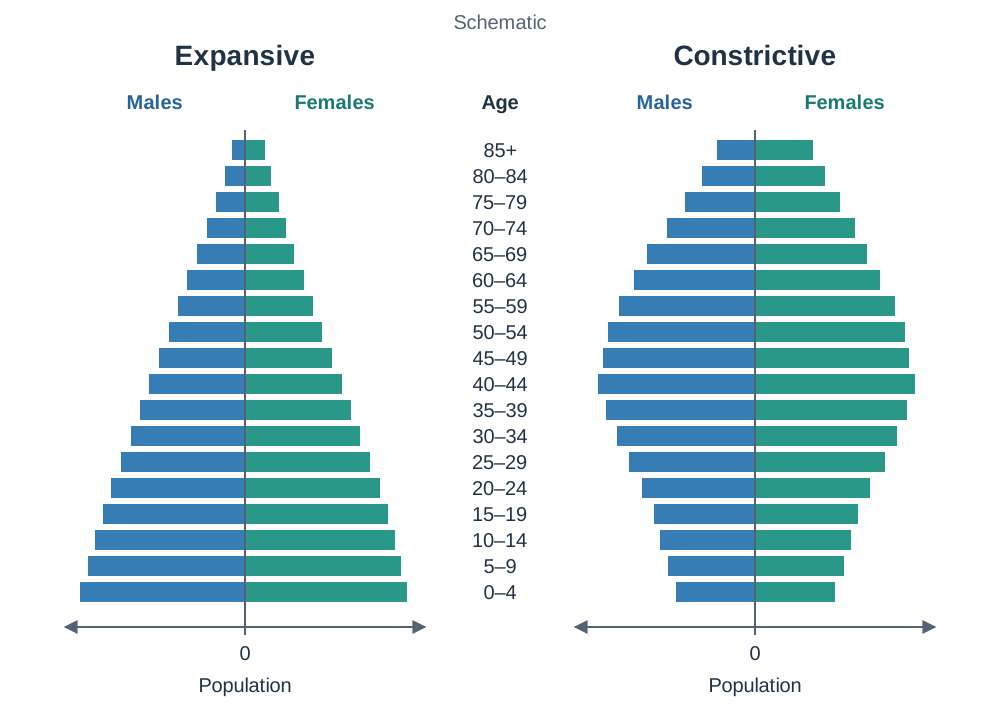
A population pyramid is a back-to-back horizontal bar chart dividing a population into five-year age cohorts. Males are conventionally plotted on the left and females on the right, but always check axis labels and keys carefully to confirm the layout and whether values are shown as raw numbers or percentages.
- Expansive profiles (wide base, narrow apex): Indicate high birth rates and low life expectancy, typical of developing countries.
- Constrictive or stationary profiles (narrowing base, wide middle and top): Indicate low birth rates and an ageing population, typical of Ireland and Western Europe.
- In cohorts aged 75 and over, female horizontal bars are almost always longer than male bars, providing direct visual evidence of higher female life expectancy.
The Dependency Ratio
The dependency ratio measures the economic pressure placed on the working-age population by non-active age groups: Dependency ratio = ((Young dependents aged 0–14 + Old dependents aged 65+) ÷ Working-age population aged 15–64) × 100
Peripheral rural counties (such as Donegal, Mayo, and Roscommon) consistently exhibit high dependency ratios, frequently exceeding 55% to 60%. This is caused by the out-migration of working-age adults (aged 18–35), leaving behind an older population structure. In contrast, urban counties (such as Dublin and Kildare) show lower dependency ratios because their tertiary job markets and educational institutions attract and retain young working adults.
Tables and Graphs in Core Unit 3 (Geographical Investigation)
In Core Unit 3, which is worth 20% of your total examination grade, you must collect primary field data and present your findings systematically in your written report.
Preparation of the Report Stage
This reporting stage requires you to organise and illustrate your primary and secondary data:
- Data Tabulation: Field measurements must be recorded in structured tables with clear headings and explicit measurement units (such as river velocity in m/s, pebble long-axis lengths in cm, or pedestrian counts).
- Graph Selection: Select the graph format that matches your investigation's hypothesis. Plot river longitudinal profiles as line graphs. Use scatter graphs with lines of best fit to examine bedload attrition (pebble size versus distance downstream). Use divided bar charts or pie charts to illustrate traffic tallies or urban land-use categories.
- Presentation Rules: Every drawn figure must include an informative title with location and date, fully labelled axes with units, an appropriate linear scale starting at zero where applicable, and a key.
Conclusion and Evaluation Stage
At Higher Level, this stage requires you to analyse your graphical results and evaluate the validity of your study:
- Analyse trends and draw valid conclusions directly linked to your initial hypotheses.
- Compare your graphical findings with established geographical theory (for example, comparing bedload size decline to Bradshaw's model of river change).
- Critically evaluate data reliability. Two survey dates provide isolated snapshots rather than proof of an ongoing seasonal trend. A truncated bar chart axis starting above zero exaggerates visual differences, and a single survey site cannot be assumed to represent an entire drainage basin or coastline.
Facts and Explanations for the 4-Mark Questions
To secure the full 4 marks (2 SRPs) in the explanatory parts of Part A, you must support your reasoning with specific Irish facts, named locations, or named policies.
Population and Demographics (Census 2022)
- Ireland's population reached approximately 5.15 million in Census 2022, an increase of roughly 8% since 2016.
- About 15% of the population is aged 65 or over, and the average national age has risen to nearly 39 years.
- Effects of a rising dependency ratio include a higher tax and PRSI burden on the 15–64 workforce; growing demand for state pensions, acute hospital beds, and home-care support; and falling enrolments in rural primary schools as young adults migrate away.
Energy and Electricity Generation
- In 2022, natural gas was Ireland's largest fuel source for electricity generation, accounting for roughly 53%.
- Wind energy supplied approximately 25% of national generation, rising from 12% in 2012.
- Coal accounted for about 12%, while traditional peat harvesting for commercial electricity ceased completely.
- Key examples to quote include Moneypoint power station in Co. Clare (coal/oil backup) and major wind farms such as Oweninny, Co. Mayo, and Derrybrien, Co. Galway.
Commercial Sea-Fishing and Seafood
- Major designated fishery harbours include Killybegs (Co. Donegal), Castletownbere (Co. Cork), Howth (Co. Dublin), and Dunmore East (Co. Waterford).
- Key challenges to explain include strict quota limits under the EU Common Fisheries Policy; the post-Brexit trade agreement, which transferred valuable mackerel and prawn quota back to the UK fleet; elevated marine diesel costs; and commercial competition from international factory ships and aquaculture imports.
Tourism and Regional Contrasts
- Dublin attracts approximately two-thirds of all overseas visitors to Ireland because Dublin Airport and Dublin Port serve as the country's primary international transport gateways, and the city holds a dense cluster of major cultural attractions (such as the Guinness Storehouse and Trinity College).
- Key challenges facing the tourism sector include pronounced seasonality outside Dublin, high accommodation and hospitality costs, and weather dependency along western coastal routes like the Wild Atlantic Way.
Key terms
- Significant Relevant Point (SRP)
- A single piece of accurate, factual, and geographically relevant information, named example, or developed explanation (typically awarded 2 marks) used by SEC examiners to score Leaving Certificate answers.
- Dependency Ratio
- The mathematical ratio of dependents (people aged 0–14 and 65+) to the economically active, working-age population (aged 15–64), expressed as a percentage.
- Percentage Point
- The unit for the direct numerical difference between two percentages (e.g. a shift from 12% to 25% is an increase of 13 percentage points).
- Divided (Stacked) Bar Chart
- A bar chart where each bar represents an overall total and is divided into proportional segments, read by subtracting the lower baseline value from the upper boundary value.
- Positive Correlation
- A relationship between two variables on a scatter graph where both values increase together, producing a cluster of points sloping upwards from bottom-left to top-right.
- Negative Correlation
- A relationship between two variables on a scatter graph where one value increases as the other decreases, producing points sloping downwards from top-left to bottom-right.
- Anomaly
- A data point or observation that deviates significantly from the overall trend, pattern, or line of best fit in a geographical dataset.
- Natural Increase
- The positive difference between the number of live births and the number of deaths in a population over a given period, excluding migration.
- Net Migration
- The difference between the number of immigrants entering an area and the number of emigrants departing over a specified period.
- Common Fisheries Policy
- The European Union policy that sets total allowable catches, fishing quotas, and maritime conservation rules for member state fleets.
Check yourself
A village of 500 people has 68% daily Irish speakers. Calculate the number of daily Irish speakers.
Value = (68 / 100) 500 = 0.68 500 = 340 people.
A county of 60,000 people records 900 births and 540 deaths in one year. Calculate its birth rate and its natural increase.
Birth rate = (900 / 60,000) * 1,000 = 15 per 1,000 people. Natural increase = 900 - 540 = 360 people.
Brazil's HDI is 0.759 and Sierra Leone's HDI is 0.419. Calculate the difference between them.
Difference = 0.759 - 0.419 = 0.340 (no unit is used for index figures, and the three decimal places are retained).
An axis runs from 40 to 60 with four divisions between the numbered gridlines. What is the value of one division?
Value = (60 - 40) / 4 = 20 / 4 = 5 units.
In a 100% stacked bar chart, an energy segment for natural gas starts at 42% on the vertical axis and ends at 95%. What percentage share does natural gas represent?
53% (calculated as 95% - 42% = 53%).
A county census records 14,000 children (0–14), 11,000 retirees (65+), and 50,000 working-age adults (15–64). Calculate the dependency ratio.
Total dependents = 14,000 + 11,000 = 25,000. Dependency ratio = (25,000 / 50,000) * 100 = 50.0%.
Why do peripheral rural counties in Ireland typically have higher dependency ratios than eastern urban counties?
Rural counties experience outward migration of young adults (aged 18–35) seeking third-level education and jobs in cities, reducing the working-age cohort (15–64) and leaving behind a higher proportion of elderly dependents.