

The Geographical Investigation (Core Unit 3) is a compulsory coursework project worth 20% of your final Leaving Certificate Geography mark. It carries 100 marks alongside the 400-mark written paper, giving a subject total of 500 marks. The State Examinations Commission (SEC) issues an annual list of prescribed topics to schools during fifth year, and you submit your completed report towards the end of Term 1 in sixth year. Although your class can carry out fieldwork together on one study, each candidate must present an entirely individual report written in their own words. Group projects are not accepted, and both your geography teacher and school principal must sign a declaration confirming that the report is your own authentic work. The syllabus requires that your evidence maintains a balance of 60% primary data collected directly in the field and 40% secondary data gathered from published sources. At Higher Level, you must demonstrate the full range of spatial skills, apply statistical and digital tools including GIS, compare your results with established geographical theory and other studies, and critically evaluate the reliability and validity of your investigation.
Coursework Requirements, Topic Selection, and Assessment Structure
Your investigation topic must come from the annual list issued by the SEC to your school for your exam year. Always check the exact wording of the prescribed topic before writing your aim and hypotheses, as reusing an old topic title or drifting away from the issued brief will cost you marks.
Where the investigation sits in your assessment
Your report is completed in a dedicated booklet and assessed externally outside the terminal written exam. You do not write about your project in the June exam hall. However, the spatial skills you practise during the investigation appear throughout the written paper: grid references, scale, distance, contour interpretation, sketch maps, cross-sections, aerial and satellite photograph analysis, synoptic weather maps, census interpretation, and digital mapping. Mastering these skills earns you marks in your coursework booklet and prepares you for the written examination.
Syllabus rules for the report
- Individual authenticity: While class groups may collect data together in the field, each candidate must submit a full and complete report of their own. Copied phrasing, shared conclusions, or duplicated evaluations will breach examination regulations.
- Evidence balance: Your study must draw upon 60% primary data and 40% secondary data. This ratio applies to your sources of evidence rather than a rigid booklet page count or mark split. Primary data includes field measurements, tallies, questionnaires, annotated photographs, and field sketches. Secondary data includes Ordnance Survey maps, Met Éireann weather charts, OPW river levels, Central Statistics Office (CSO) returns, and geological survey records.
- Sequential structure: The syllabus organizes the project into five distinct stages that must be completed in order:
- Stage 1 – Introduction: Posing the problem, stating the aim, hypotheses, objectives, and information required.
- Stage 2 – Planning: Selecting gathering methods, designing recording sheets, establishing sampling frameworks, and preparing a risk assessment.
- Stage 3 – Collection of Data: Carrying out primary and secondary gathering and noting practical problems encountered.
- Stage 4 – Preparation of the Report: Organising data, presenting graphs, maps, and tables, and applying statistics and ICT.
- Stage 5 – Conclusion and Evaluation: Interpreting results, evaluating hypotheses against data, comparing findings with established theory and other studies, and offering evidenced methodological critiques.
Distinct Higher Level requirements
Higher Level candidates are assessed against three specific expectations that do not apply to Ordinary Level:
- You must apply the full range of geographical skills rather than a partial selection.
- You must apply statistical analysis and information technology to the analysis and interpretation of results, not just basic descriptive reporting.
- You must actively evaluate your findings and make direct comparisons with established theory and named other studies.
Stages 1 & 2 – Devising Strategy, Sampling, Recording Instruments, and Safety
Stage 1 and Stage 2 establish the scientific framework of your investigation before you step into the field.
Aim, Hypotheses, and Objectives
An aim defines the broad geographical purpose of the study. A hypothesis is a precise, testable prediction linking two variables that can be supported or rejected using your collected numbers. An objective is an action step detailing how you will collect the required data.
Always write testable hypotheses that name the variable, the direction of change, and the locations compared:
- Weak hypothesis: Rivers change downstream.
- Strong hypothesis: Channel cross-sectional area and mean velocity increase downstream from Site 1 to Site 3.
- Weak hypothesis: Shops are different in the town centre.
- Strong hypothesis: The proportion of ground-floor retail units decreases, and residential units increase, with distance from the town centre along our survey transect.
Sampling Frameworks
You must choose and justify an appropriate sampling technique to avoid bias:
- Systematic sampling: Taking measurements at regular, fixed spatial or temporal intervals, such as recording water depth at equal intervals across a river channel transect or counting pedestrians every 200 metres along a street transect.
- Stratified sampling: Dividing the study area or population into known sub-categories and sampling proportionately from each, such as choosing sample sites across the upper, middle, and lower courses of a river, or categorising an urban area into commercial, residential, and industrial zones.
- Random sampling: Using random numbers or coordinate pairs to select points across a surface without human preference, such as selecting quadrat placements across a sand dune.
Designing Recording Sheets and Questionnaires
Stage 2 requires you to design your recording instrument before going into the field, and you should include a clean, blank copy in your report:
| Site | Grid Ref. | Time | Wetted Width (m) | Depth 1 (m) | Depth 2 (m) | Depth 3 (m) | Depth 4 (m) | Depth 5–8 as needed (m) | Float Times (s) | Wetted Perimeter (m) | Weather |
|---|
If your topic uses a questionnaire, keep it focused:
- Use 6 to 8 closed questions with tick-boxes so responses can be quantified and graphed.
- State your sample size and selection rule (for example, every fifth adult passing our survey point between 10:30 and 11:30, reaching 25 respondents).
- Sample questions should record travel mode (walk, bus, car), journey distance (under 1 km, 1–5 km, 5–15 km, over 15 km), and visit purpose (convenience shopping, comparison shopping, services, employment).
Health and Safety Risk Assessment
You must identify field hazards, assess the potential consequences, and outline practical precautions:
| Hazard Identified | Potential Risk / Consequence | Precaution and Control Measure |
|---|---|---|
| Slippery river boulders or steep banks | Slips, falls, fractures, or sprains | Wear boots with deep-tread grip soles; use wading poles; always work in pairs. |
| Fast river currents or deep pools | Being swept downstream, hypothermia | Check the Met Éireann 48-hour rainfall record and the nearest OPW/EPA gauging station on waterlevel.ie before leaving; never wade above knee height; wear certified buoyancy aids. |
| Traffic along urban or roadside survey transects | Collision with vehicles | Wear high-visibility vests; stay on pedestrian footpaths; survey facing oncoming traffic. |
| Approaching strangers or lone working in public areas | Personal safety risks or confrontation | Work in designated pairs in daylight public spaces; ensure school staff know your exact transect and return time. |
Stage 3 – Data Collection: Fluvial and Coastal Fieldwork (Pathway A)
If your prescribed topic relates to physical processes, you will collect physical field measurements and contextualise them with secondary records.
Fluvial Techniques
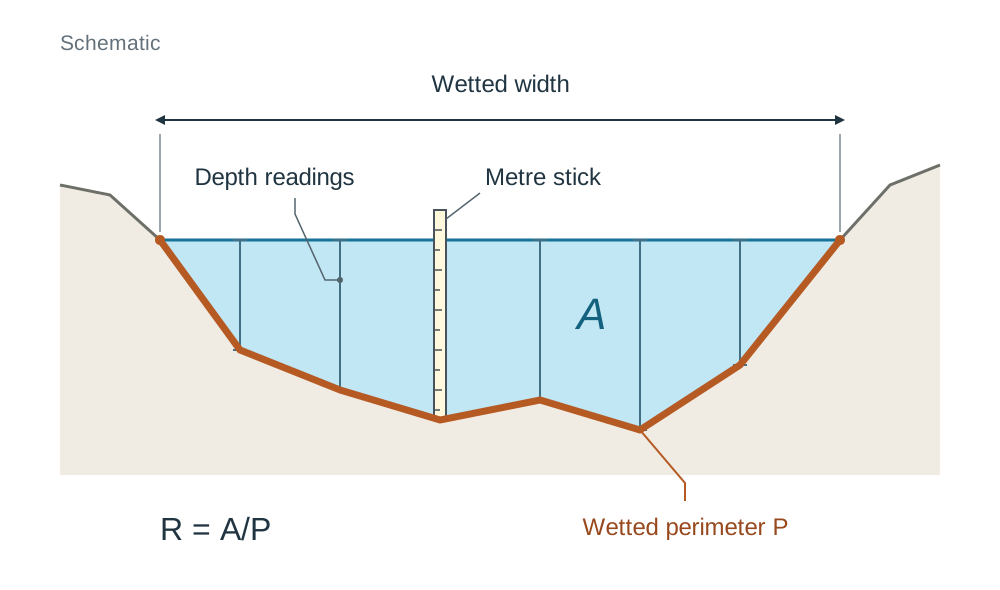
- Channel width: Stretch a fibreglass measuring tape taut between the waterlines on opposite banks to record wetted width.
- Channel depth: Divide the wetted width into equal intervals and take a depth reading at each one (four readings in a narrow channel, more in a wide one) by placing a metre stick vertically on the riverbed, holding the narrow edge against the current to prevent water piling up.
- Velocity: Measure an unobstructed 10-metre reach along the bank. Release a low-drag surface float (such as a citrus fruit or small float) upstream of the start line and use a digital stopwatch to record the time taken to travel the 10 metres. Repeat three times to calculate a mean float time. Water at the surface moves faster than water near the bed and banks because of friction, so multiply your calculated surface float velocity by a standard bed-friction correction factor of 0.85 to estimate average cross-sectional velocity (mean channel velocity).
- Bedload analysis: Sample 20 pebbles at each site across the transect. Measure the intermediate () axis in millimetres using callipers and classify each pebble using the Powers roundness scale (ranging from 1 = very angular to 6 = well-rounded).
Coastal Techniques
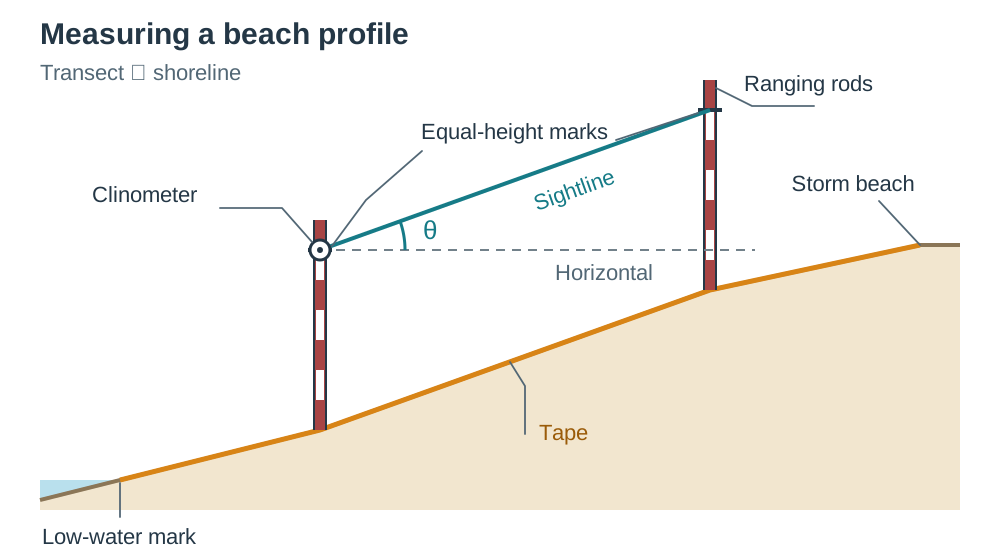
- Beach profile: Lay a tape perpendicular to the shoreline from the low-water mark up to the storm beach. Use two ranging rods and a hand clinometer to record slope angles between each visible break in slope.
- Wave frequency and type: Count breaking waves for one full minute at three separate intervals. Constructive waves typically break at 6 to 8 waves per minute with a strong swash and weak backwash, depositing sediment. Destructive waves break at 10 to 14 waves per minute with a weak swash and strong backwash, eroding the beach.
- Longshore drift: Place 20 brightly painted pebbles at the swash line. Record their lateral displacement along the shoreline after 30 minutes to determine drift direction and rate.
Secondary Data and Practical Problems
Complement your field measurements with secondary sources: 1:50,000 OS Discovery Series maps for catchment relief, Met Éireann rainfall figures for the preceding 48 hours, and OPW hydrometric records to verify whether your stream was running at normal baseflow. Always document practical problems encountered, such as an impeller flow meter clogging with weed or glare obscuring riverbed pebbles.
Stage 3 – Data Collection: Urban and Human Fieldwork (Pathway B)
If your topic focuses on human geography, settlement patterns, or local economic activities, the five stages remain identical, but your instruments and data sources change.
Practical Investigation Framework
- Aim: To investigate the pattern of ground-floor land use and pedestrian footfall along a transect from the centre of Naas, County Kildare, to the edge of the built-up area.
- Hypothesis 1: The proportion of retail and office use falls, and residential use rises, with increasing distance from the town centre.
- Hypothesis 2: Pedestrian footfall is highest in the peak land-value zone and declines outwards.
Primary Urban Methods
- Land-use mapping: Walk a chosen transect line, colour-coding each ground-floor unit on a large-scale street base map into functional classes: retail (convenience and comparison), professional offices, food and drink, residential, industrial, and vacant premises.
- Pedestrian counts: Carry out synchronised 10-minute pedestrian tallies using hand tally counters at three fixed survey stations along the transect at the same time of day.
- Questionnaires: Administer 20 short questionnaires at designated survey points to discover where visitors travelled from, their transport mode, and the primary purpose of their visit.
- Annotated photographs and field sketches: Photograph shop frontages, building heights, and vacant premises. Annotate each photograph with a figure number, date, time, grid reference, viewing direction, and labelled arrows showing key features like upper-floor conversions or vacant shop units. A field sketch is a labelled pencil drawing made on-site that highlights functional zoning and transport links.
Secondary Urban Sources
Gather secondary context from the Central Statistics Office (CSO) Census Small Area Population Statistics (SAPS) for demographic data, the Local Authority County Development Plan for statutory zoning maps, and historic Ordnance Survey maps to trace how the urban boundary expanded over time.
Stage 4 – Preparation of the Report: Calculations, Statistics, GIS, and Organisation
Stage 4 covers processing your raw field data into tables, graphs, calculations, and spatial maps using information technology.
Hydrological and Channel Calculations
Discharge is measured in cubic metres per second (), also known as cumecs.
The wetted perimeter () is the total length of the channel bed and banks in direct contact with water. Measure it by pressing a chain or flexible tape along the channel bed from waterline to waterline. Channel efficiency is measured using the hydraulic radius ():
- Site 1: ,
- Site 3: ,
A larger hydraulic radius means that less water touches the frictional channel boundaries, so frictional drag decreases and the channel transports water more efficiently downstream.
Statistical Analysis
Higher Level students must calculate summary statistics rather than just raw totals. For example, intermediate pebble axis measurements at Site 3 (mm): 40, 52, 48, 61, 48, 39, 55.
- Mean:
- Median: Middle value when ordered (39, 40, 48, 48, 52, 55, 61) =
- Mode: Most frequent value =
- Range: Largest minus smallest =
- Percentage change: From Site 1 (mean 92 mm) to Site 3 (mean 49 mm) =
Using GIS in Your Investigation (Higher Level)
A Geographical Information System (GIS) is digital software that overlays different layers of spatial information (modern maps, historic maps, orthophotographs, and census statistics) tied to real coordinates.
The syllabus lists four named study combinations:
- Aerial photographs + census material + maps to study urban sprawl
- Satellite images + statistical information to study changing agricultural land use
- Aerial photographs + maps + statistical information to study forestry development
- Maps + aerial photographs + the Record of Monuments and Places to study the destruction of archaeological sites
To apply GIS, use online viewers such as GeoHive (geohive.ie) or MyPlan.ie. Compare historic 6-inch maps against modern orthophotographs of your study area, take screenshots of the identical extent, label each with a grid reference and date, and describe the change (for example, agricultural fields converted to housing estates). This demonstrates IT use, map interpretation, and secondary sourcing together.
Report Presentation Rules
Number every figure and table (for example, Fig. 1: Cross-Section at Site 3) and refer to it directly in your text. Put completed raw recording sheets in an appendix. Cite every secondary source with precision: give the map series, sheet number, and edition date, or the exact CSO Census table code, Met Éireann weather station name, and date of access.
Stage 5 – Conclusion and Evaluation: Theory, Anomalies, and Critical Review
Stage 5 requires you to draw evidence-based conclusions, evaluate your hypotheses, compare your results with established theory, and reflect critically on your methodology.
Evaluating Hypotheses
Never state that your hypothesis has been 'proven'. State clearly whether each hypothesis is supported, partly supported, or rejected by your data, quoting exact figures, units, and site comparisons to prove your point.
Comparing with Established Theory and Studies
Higher Level students must compare findings with recognized theoretical models and external studies:
- Fluvial studies: Compare your trends with the Bradshaw Model, which predicts that channel width, depth, velocity, and discharge increase downstream while bedload particle size and channel slope decrease.
- Urban studies: Compare your transect with the Burgess Concentric Zone Model, the Hoyt Sector Model, and bid-rent theory (commercial users outbid others for central, accessible land, forcing residential use outwards). Note where your study town diverges, such as an out-of-town shopping centre breaking the inward concentration of retail.
- Named external comparisons: Compare your figures with an existing study, such as an EPA river quality report, an OPW catchment flood study, Geological Survey Ireland records, or a previous project report from your own school archives. State the author, title, and year of the comparison study.
Explaining Anomalies
Identify any result that broke the expected pattern. For instance, if pebble size spiked at an intermediate river site, explain the local cause, such as a steep tributary washing coarse, angular scree into the main channel just upstream of the survey point.
Structuring Methodological Critiques
Every evaluation point must follow a three-part structure: limitation — likely effect on the result — practical improvement.
- Example 1: Our float velocity trials were conducted on the surface where friction is lowest, which overestimated downstream velocity. A mechanical impeller flow meter positioned at 0.6 of the channel depth would provide a more accurate measurement of average flow.
- Example 2: Sampling 20 pebbles per site by hand introduced human selection bias towards larger, more visible stones, skewing our mean particle size upwards. Placing a 50 cm 50 cm wire quadrat on the riverbed and measuring 50 pebbles beneath regular grid intersections would remove operator bias.
Key terms
- Geographical Investigation
- A compulsory coursework project accounting for 20% of Leaving Certificate Geography (100 marks out of 500), completed individually from an SEC-prescribed topic list.
- Primary Data
- First-hand geographical measurements, tallies, and observations gathered directly by the student in the field, making up 60% of investigation evidence.
- Secondary Data
- Published maps, census figures, meteorological records, and historical archives gathered from external sources, making up 40% of investigation evidence.
- Hypothesis
- A testable prediction stating an expected relationship or pattern between two geographical variables that can be supported or rejected by data.
- Systematic Sampling
- A data collection strategy where observations or measurements are taken at regular, fixed spatial or temporal intervals.
- Stratified Sampling
- A sampling technique where a study area or population is divided into distinct subgroups and sampled proportionately within each category.
- Discharge
- The volume of water passing through a river channel cross-section per second, calculated as cross-sectional area multiplied by mean velocity () and measured in cumecs (m³/s).
- Hydraulic Radius
- The ratio of a stream's cross-sectional area to its wetted perimeter (), serving as an index of channel efficiency.
- Wetted Perimeter
- The total length of the channel bed and banks that is in direct contact with the flowing water.
- Bradshaw Model
- An established geographical model illustrating downstream changes in river channel width, depth, velocity, discharge, gradient, and sediment size.
- Burgess Concentric Zone Model
- An urban land-use model showing concentric rings of activity, with a central business district surrounded by industrial, working-class, and commuter residential zones.
- Hoyt Sector Model
- An urban land-use model proposing that functional zones expand outwards in wedges or sectors along major transport corridors from a central business district.
- Geographical Information System (GIS)
- A digital software tool that stores, manages, analyses, and visualises multiple layers of georeferenced spatial data.
- Constructive Waves
- Low-frequency coastal waves (breaking at roughly 6 to 8 per minute) characterized by a strong swash and gentle backwash that deposit sediment on a beach.
- Destructive Waves
- High-frequency coastal waves (breaking at roughly 10 to 14 per minute) characterized by a weak swash and powerful backwash that erode sediment from a beach.
- Powers Roundness Scale
- A standard visual chart used in sediment analysis to classify clasts into six categories ranging from very angular (class 1) to well-rounded (class 6).
Check yourself
What is the assessment weighting and mark allocation of the Geographical Investigation in the Leaving Certificate?
It accounts for 20% of your total Leaving Certificate Geography grade, carrying 100 marks alongside the 400-mark terminal written examination (500 marks total).
What is the required syllabus ratio between primary and secondary sources of information?
60% primary sources (first-hand field measurements and observations) and 40% secondary sources (published maps, archives, and official datasets).
List the five distinct stages of the Geographical Investigation in the official syllabus order.
1. Introduction; 2. Planning; 3. Collection of data; 4. Preparation of the report; 5. Conclusion and evaluation.
Why is surface float velocity multiplied by 0.85 to estimate mean channel velocity?
Water at the surface moves faster than water near the bed and banks where friction slows the current; multiplying by 0.85 gives an estimate of average velocity across the entire water column.
State the formula used to calculate river discharge and name its standard unit.
Discharge (Q) = Cross-Sectional Area (A) × Velocity (v), measured in cubic metres per second (m³/s or cumecs).
Name one primary and one secondary source used in a GIS study of urban sprawl, and explain how GIS combines them.
Primary: annotated aerial photographs or ground land-use mapping. Secondary: CSO Small Area Population Statistics or OS historic maps. A GIS viewer layers them over the same coordinates to reveal changes in housing density and land use over time.
Rewrite this weak evaluation comment properly: 'It rained so our results were bad.'
Limitation: 14 mm of rain fell in the 24 hours before fieldwork, placing the river in storm runoff rather than baseflow. Likely effect: Velocity and discharge figures were higher than seasonal averages and did not match published annual baseflow records. Practical improvement: Check OPW gauging data on waterlevel.ie to confirm normal baseflow, and repeat measurements after a 48-hour dry spell.