

Ordnance Survey (OS) map questions appear on the Higher Level paper every year. They are some of the easiest marks to secure if you practise the methods below. 1:50 000 OS maps appear regularly in the 8-mark short questions in Part One (usually four parts at 2 marks each). They also provide the evidence for longer map-based answers in the core and elective questions. This guide covers core measurements, location techniques, relief and drainage interpretation, landform recognition, and cross-sections.
Scale, Distance, and Area Calculations
Ordnance Survey Ireland maps on the Leaving Certificate exam are drawn to a scale of 1:50 000. This representative fraction means on the map equals on the ground, which works out at or . The core rule to remember is that 2 cm = 1 km.
Straight-Line Distance
To measure straight-line distance (as the crow flies), lay the straight edge of a piece of paper between the two points. Mark both points on the paper with a sharp pencil. Lay your strip against the printed linear scale bar at the bottom of the map, or measure the line in centimetres and divide by 2.
For example, if the distance between a roundabout and a church measures on the paper, the ground distance is . Always write the unit (km).
Curved Distance
To measure distance along a winding road, railway, or river, use a straight strip of paper. Place the paper at the starting point. Follow the bends step by step, pivoting the paper edge around each curve and making a small pencil tick on the paper at every turn. Keep working until you reach the end point. Place the marked strip against the printed scale bar, or measure the full length in centimetres and divide by 2.
For example, if measuring the length of a regional road gives a total of on the strip, calculate .
Area Calculations
Each blue grid square measures on paper, which represents on the ground. Never multiply the map centimetres () to get .
For a regular area, count the grid squares across and down:
- Count the squares from east to west (for example, 12 squares).
- Count the squares from north to south (for example, 8 squares).
- Multiply them: .
If the question asks for 'land area' only or an irregular zone:
- Count every full grid square in the specified zone.
- Ignore any square that is more than half covered by sea or lake water.
- Count any part-square that is more than half land as a full square ().
For example, if a coastal zone covers grid squares, and 6 of those squares are mostly sea, the land area is .
Location, Grid References, Direction, and Symbols
The map shows two ways of giving location, and you should be able to use both:
Absolute and Relative Location
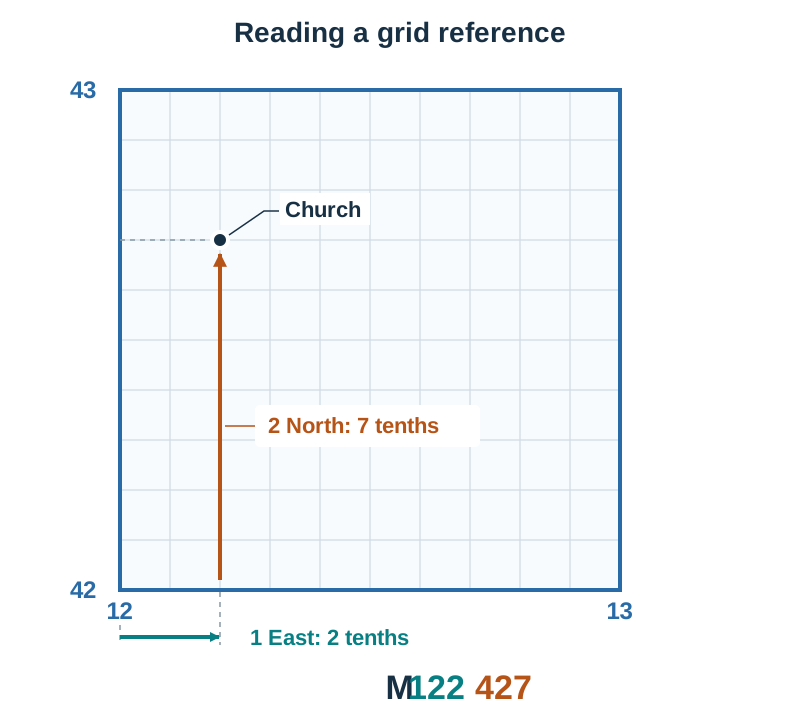
Absolute location is the exact position of a feature using a grid reference or latitude and longitude. Latitude and longitude are printed in degrees and minutes around the edge of the OS map. Read latitude (north of the Equator) up the sides and longitude (west of Greenwich) along the top and bottom. For example, a church sits at M 122 427.
Relative location describes where a place is in relation to other features around it using distance, compass direction, and named landmarks. For example: 'The town lies on the east bank of the river, about 3 km south-west of the summit at 542 m, at the junction of the N24 and the R688.' When an exam question asks to describe the location of a town, give both absolute and relative details.
National Grid References
Ireland is divided into 100 km lettered sub-zones (such as H, M, N, R, S, T, V, W). Always write the sub-zone letter first (e.g. S 206 225). Every past-paper answer shown includes it, and without it the reference could be anywhere in Ireland.
- Four-figure references identify a full square. Read the vertical line (Easting) on the west (left) side of the square first, then the horizontal line (Northing) on the south (bottom) side: along the corridor, then up the stairs. For example, square S 20 22.
- Six-figure references pinpoint a precise spot to within 100 metres. Mentally divide the square into tenths from 0 to 9. Take the Easting, estimate how many tenths east the point lies, take the Northing, and estimate how many tenths north it lies. For example, a church 2 tenths east into square 12 and 7 tenths north into square 42 is M 122 427.
Direction and Aspect
Past questions usually ask for a compass direction (such as NW or NNW) rather than a bearing in degrees, so answer with a compass point unless the question asks for degrees. Learn the 16-point compass in clockwise order: N, NNE, NE, ENE, E, ESE, SE, SSE, S, SSW, SW, WSW, W, WNW, NW, NNW. For a bearing with a protractor, measure clockwise from Grid North ( to ).
Aspect is the compass direction a hillside faces as you look downhill. To find aspect:
- Look at the contour values to find the high ground.
- Imagine walking straight downhill, crossing the contours at right angles.
- The direction you walk is the aspect (for example, north-west or NW).
South-facing slopes receive more insolation (heat and light from the sun), making them warmer and better for farming and housing than shaded north-facing slopes.
Map Symbols and Legends
Questions often ask you to identify amenities, roads, and land cover. Always name the symbol exactly as the legend words it:
| Category | How to read it on the map | Examples asked |
|---|---|---|
| Antiquities | Red or purple writing and symbols | Castle, megalithic tomb, star-shaped fort |
| Public services | Blue symbols, red lettering, or abbreviations | Garda station, post office (PO), parking (P) |
| Land cover | Green shading with tree icons; check legend carefully | Coniferous plantation (pointed trees), mixed woodland |
| Land cover | Blue tufts on white ground | Marsh or bog (poorly drained land) |
| Tourist & amenity | Symbols explained in the tourist legend box | Nature reserve, picnic site, trailhead, viewpoint |
Road classes are shown by different colours and widths: motorway (M), national primary and national secondary (N), regional (R), and third-class local roads. Always confirm the exact colour and road number from the legend printed on your exam sheet.
Interpreting Relief and Slopes
Relief means the shape and height of the landscape. Three main map tools show elevation:
- Contours: Brown lines joining points of equal height above sea level. The standard contour interval (10 m) means every line is 10 vertical metres apart. An index contour is a thicker brown line printed every 50 metres with its height labelled, making counting quick.
- Spot heights: A black dot beside a number showing the exact height in metres on that spot (e.g. ).
- Triangulation pillars: A small blue or black triangle with a dot and elevation figure (e.g. ). These mark concrete pillars on hilltops that surveyors used to measure heights and distances when mapping the country.
Reading Slope Types
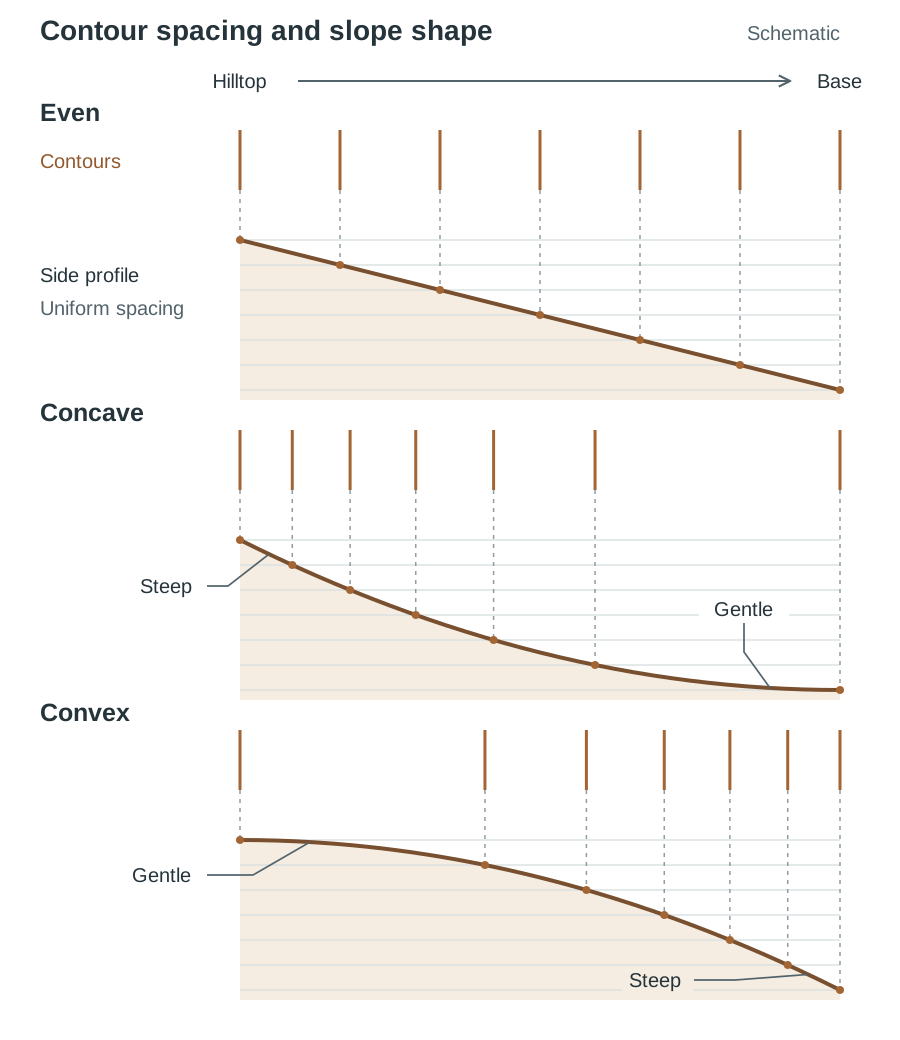
- Steep slope: Contours are packed tightly together, showing a fast climb over a short distance.
- Gentle slope: Contours are spaced widely apart, typical of valley bottoms and coastal plains.
- Even slope (uniform slope): Contours are evenly spaced from top to bottom, showing a steady gradient.
- Concave slope: Contours are closely spaced near the hilltop (steep) and spread wide apart towards the bottom (gentle), forming a scooped bowl shape.
- Convex slope: Contours are widely spaced near the top (gentle) and bunch tightly near the base (steep), creating an outward bulge.
Recognising Landforms and Drainage Patterns
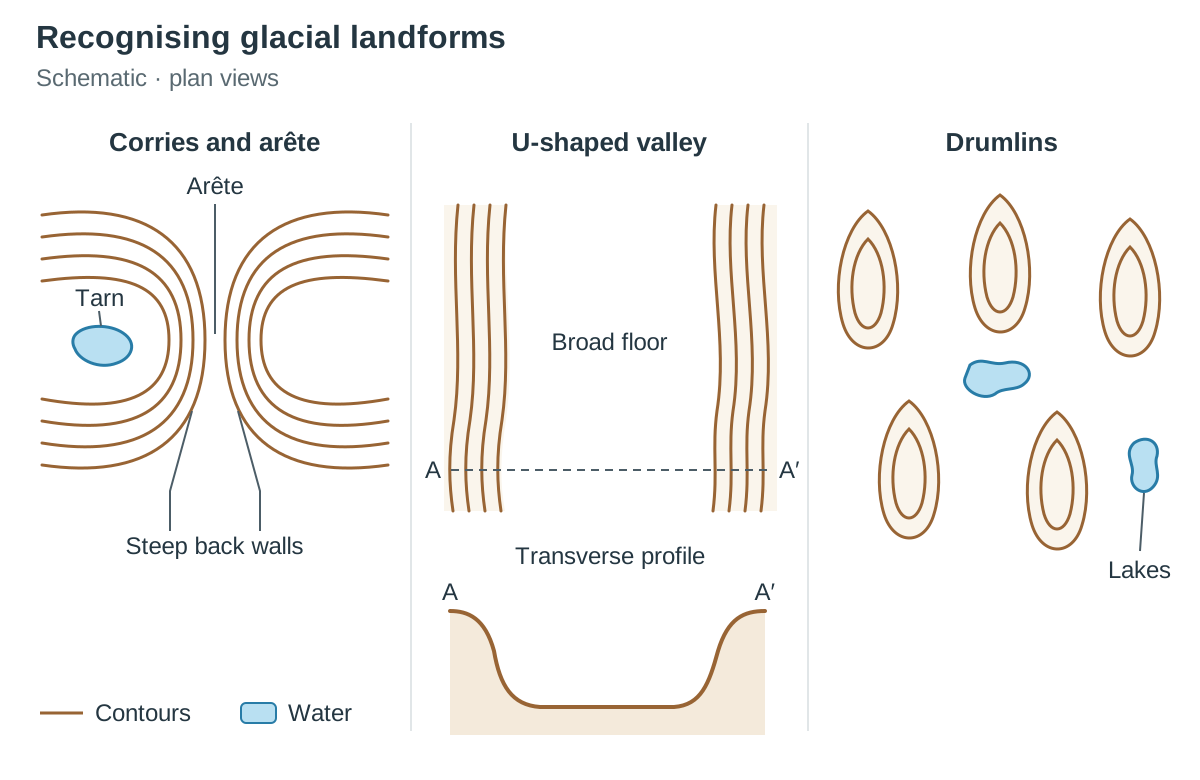
Part One short questions frequently ask you to match landforms to four-figure grid references. You can recognise them by their contour shape and shading:
| Landform | What to look for on the map |
|---|---|
| Corrie / tarn | A horseshoe of very tightly packed contours (the steep back wall) open on one side. A small lake (the tarn) sits in the hollow high in the mountains. |
| Arête | A narrow, knife-edged ridge between two corries, with contours packed tightly on both sides. |
| U-shaped valley | A flat, wide valley floor with steep sides. Contours run parallel to the valley sides and pack tightly along them. A ribbon lake often sits on the floor. |
| Drumlin | Many small, oval, egg-shaped hills, each ringed by one or two closed contours, all aligned in the same direction. Small lakes and marshy ground lie between them, typical of Cavan and Monaghan. |
| Headland | Land sticking out into the sea, with water on three sides. There are often cliff symbols at its tip. |
| Bay | A curved inlet of sea between two headlands. |
| Sand spit / beach | Yellow shading along the shore. A spit is a narrow strip of sand joined to land at one end and reaching across a bay or estuary mouth. |
| Oxbow lake | A small, horseshoe-shaped lake on a flat floodplain beside a winding river. |
| Confluence | The exact point where two rivers or streams join. |
When matching a landform to a four-figure grid reference, make sure the clearest part of the feature lies inside that 1 km square.
Drainage Patterns
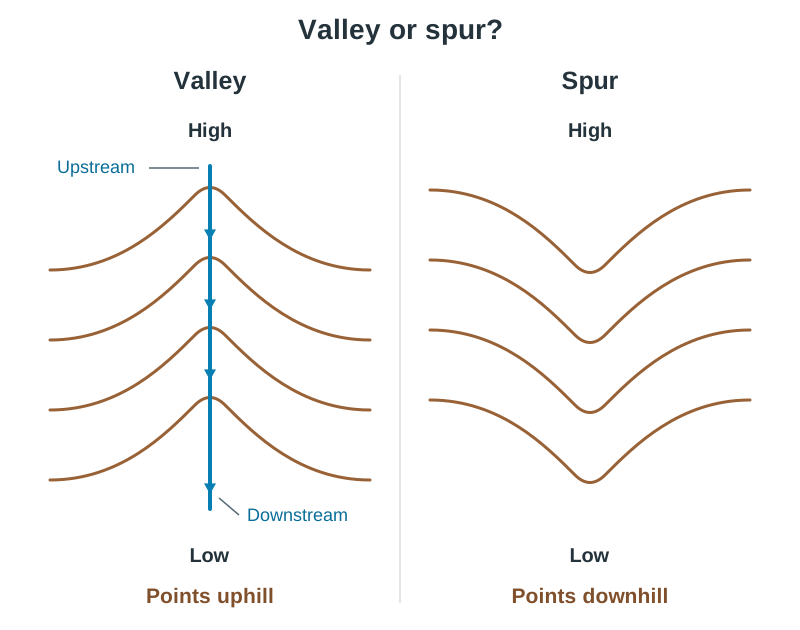
Water always flows downhill, perpendicular to contour lines. In river valleys, the V points upstream towards the river source and high ground. Water flows out of the open end of the V towards lower land. On a spur (a tongue of high ground pointing into a valley), the contour loops point downhill, towards lower ground. In a valley they point uphill.
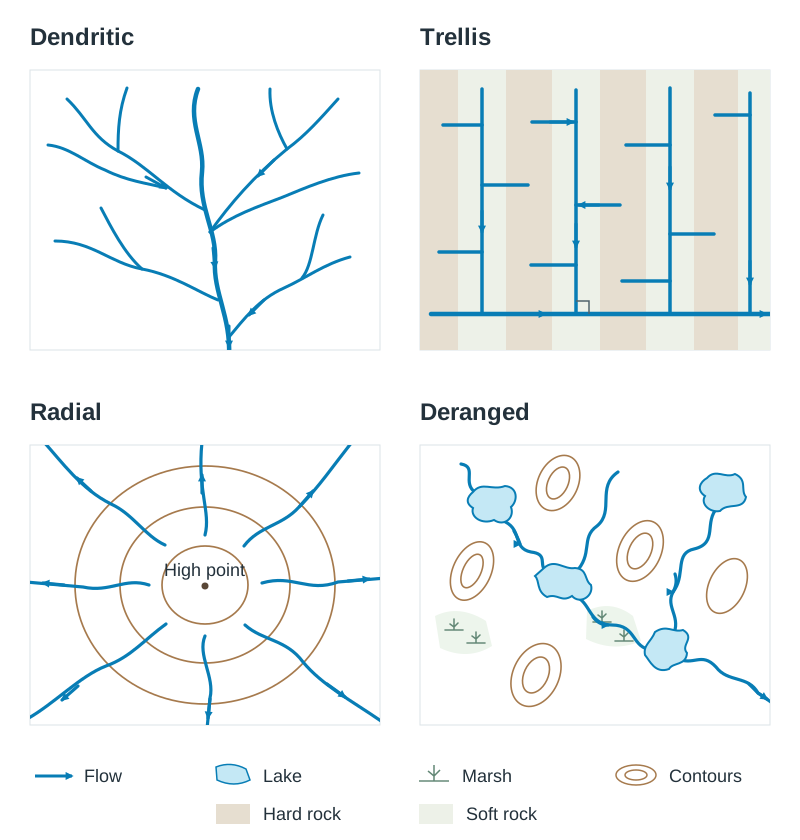
- Dendritic drainage: A branching, tree-like river network where small mountain streams join together into larger streams at acute angles. It forms where rock has similar resistance throughout.
- Trellis drainage: Tributaries join the main river at roughly right angles (). This occurs where alternating bands of hard and soft rock run parallel, as in the Munster ridge-and-valley landscape.
- Radial drainage: Streams flow outward in all directions from a central high point, like spokes on a bicycle wheel. Look for streams flowing off an isolated dome mountain or conical peak.
- Deranged drainage: Streams wander irregularly without a clear pattern. The map shows many small lakes, patches of marsh, and short streams that start and stop between low hills. It forms where glacial deposits (such as drumlins) have disrupted original drainage paths.
Topographic Profiles and Sketch Maps
The syllabus lists cross-sections and sketch maps among the Higher Level map skills. Past questions (such as 2024 Q9) have also asked students to read a supplied profile.
Reading a Supplied Profile
Exam questions often provide a completed cross-section between two points and ask you to identify features along it:
- Find the two end grid references on the map and draw a light pencil line between them.
- Match the ends first: check the letters or grid references labelled at each end of the profile. If they are not labelled, the left end is usually the first grid reference given.
- Low dips on the profile mark valleys. Check your map line at that distance to name the river flowing through it.
- Check the profile line between labelled points: a straight rise is an even slope, a dip steep at the top and flat at the bottom is a concave slope, and a curve gentle at the top and steep at the bottom is a convex slope.
- When asked to identify land cover or paths, inspect the map at that distance and name the symbol exactly as worded in the legend (for example, coniferous plantation or a named waymarked walk).
Drawing a Cross-Section
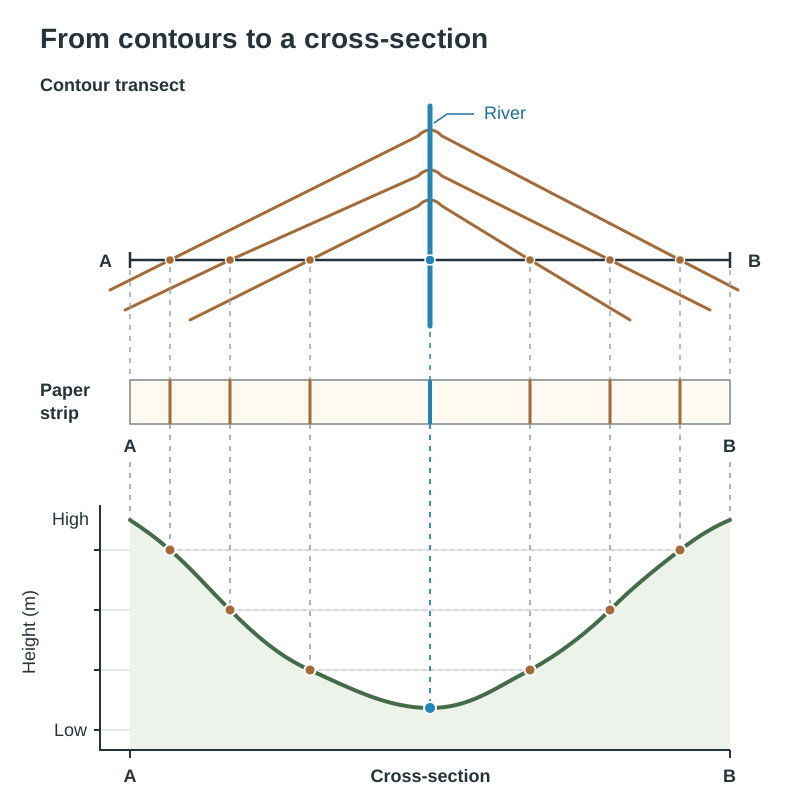
- Lay a straight strip of paper along the line connecting Point A to Point B on the map.
- Mark the exact start (A) and end (B) points on the strip.
- Tick every contour line crossing the paper edge and write its height beside the tick. Mark any river, road, or spot height.
- Draw a horizontal baseline on graph paper matching the length from A to B. Draw a vertical axis at the left, choose a clear scale (e.g. ),
and label it 'Height (m)'. Label the ends with their grid references.
- Align the paper strip with the baseline. Move directly up from each tick and plot a dot at that height.
- Connect the dots with a smooth pencil curve. Round off mountain tops rather than drawing flat lines, and add a title.
Drawing an OS Sketch Map
- Measure the length and width of the map extract. If the question asks for a half-scale sketch, divide both measurements by 2.
- Draw the frame. Divide both the map extract and your frame using light pencil grid lines (every second or fifth grid line, halved in length if half-scale). This keeps features in their correct positions and proportions.
- Draw major physical boundaries first, such as coastlines, lakes, or main rivers.
- Add only the features the question asks for (such as built-up area, land over 200 m, or a national route). Keep shapes and sizes realistic.
- Always provide a title, a north arrow, and a full key explaining every colour, line, and symbol used.
When working between an OS map and an aerial photograph, find two clear landmarks shown on both (such as a bridge, church, or river bend). Use these shared features to deduce which direction the camera was facing.
Key terms
- 2 cm = 1 km
- The scale ratio for 1:50 000 OS maps, where 2 cm on paper equals 1 km on the ground.
- Easting
- A vertical grid line that runs north to south, numbered along the top and bottom margins, read first when giving a grid reference.
- Northing
- A horizontal grid line that runs west to east, numbered along the side margins, read second when giving a grid reference.
- sub-zone letter
- The single letter identifying the 100 km square in the Irish National Grid that must be written before the digits in any grid reference.
- contour interval (10 m)
- The fixed vertical distance of 10 metres between adjacent brown contour lines on a 1:50 000 OS map.
- index contour
- A thicker brown contour line printed every 50 metres with its elevation labelled, helping to count heights quickly.
- spot height
- A black dot beside a number showing the surveyed height in metres at that exact location.
- triangulation pillar
- A concrete surveying station on a summit, shown on the map by a small triangle with a dot and height figure.
- aspect
- The compass direction a slope faces when looking downhill towards lower ground.
- concave
- A slope that is steep at the top (contours packed close) and gentle at the bottom (contours wide apart).
- convex
- A slope that is gentle at the top (contours wide apart) and steep at the bottom (contours packed close).
- even slope
- A uniform incline where contours are spaced at equal distances from top to bottom.
- the V points upstream
- The rule that contour V-shapes in a river valley point upstream towards the source and higher ground.
- dendritic
- A branching, tree-like river drainage pattern where tributaries join the main river at acute angles.
- trellis
- A drainage pattern where tributaries join the main river at roughly right angles, where parallel bands of hard and soft rock form ridges and valleys.
- radial
- A drainage pattern where rivers flow outwards in all directions from a central high summit or dome.
- deranged
- An irregular drainage pattern of wandering streams, marsh, and lakes created where glacial deposits have blocked old river courses.
- confluence
- The exact point where two rivers or streams join together.
- meander
- A pronounced loop or winding bend in a river channel across a flat valley floor.
- oxbow lake
- A curved, horseshoe-shaped lake left on a floodplain when a river cuts through a narrow meander neck.
- SRP
- Significant Relevant Point: a single developed statement of fact or explanation, usually worth 2 marks. In map questions, named examples and specific map evidence are often credited separately from the SRPs.
Check yourself
On a 1:50 000 OS map, how many kilometres on the ground does a paper measurement of 8.4 cm represent?
4.2 km. Divide 8.4 cm by 2, because 2 cm on the map equals 1 km on the ground.
Contours form a horseshoe of tightly packed lines around a small lake high in the mountains. Name the landform.
A corrie with a tarn.
Give the 16-point compass direction halfway between north and north-west.
North-north-west (NNW).
A map zone measures 7 grid squares by 5 grid squares, and 3 squares are more than half covered by sea. What is the total land area in km²?
32 km² (, and ).
What is the standard vertical contour interval on an Irish 1:50 000 OS map?
10 metres.
What drainage pattern features wandering streams, small lakes, and marshes blocked by glacial deposits?
Deranged drainage (typical of drumlin regions such as Cavan and Monaghan).