

This option looks at the atmosphere and the oceans as one connected system. The sun heats the earth unevenly, and winds and ocean currents constantly move that heat around the planet — which is what produces our weather, our climates, and the pattern of rainfall we depend on. At Higher Level, this unit is assessed through an 80-mark discursive essay structured around distinct aspects, supported by significant relevant points (SRPs) and the practical interpretation of synoptic weather data.
1. Composition and Structure of the Atmosphere and Oceans (9.1)
The atmosphere and the oceans function as an integrated fluid system, exchanging gases, moisture, and sensible and latent heat across their boundary.
Atmospheric Composition and Layers
Dry atmospheric air consists of approximately 78.08% nitrogen (), 20.95% oxygen (), 0.93% argon (), and roughly 0.04% carbon dioxide (, currently exceeding 420 parts per million). Water vapour varies spatially from near 0% over polar ice sheets to 4% over warm tropical oceans.
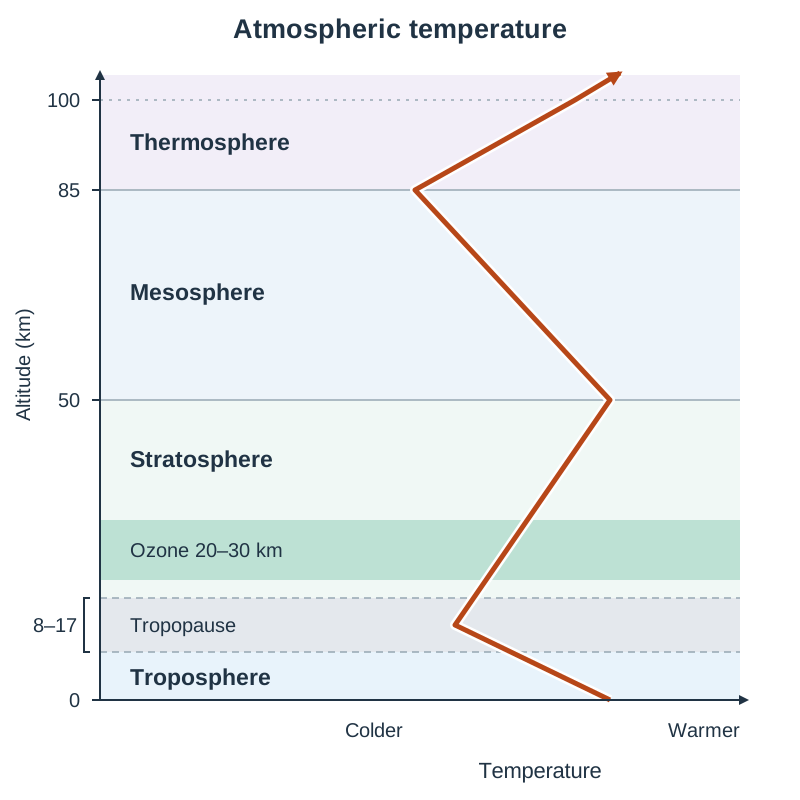
The atmosphere is divided into four thermal layers:
- Troposphere (0 to 8–17 km): Extends from sea level to roughly 8 km at the poles and 17 km at the equator. It holds 75% of atmospheric mass and almost all water vapour, so everyday weather is confined to this layer. Temperature falls with altitude at the environmental lapse rate (averaging 6.5°C per 1,000 m) because the troposphere is heated from below by terrestrial radiation. It ends at the tropopause.
- Stratosphere (from the tropopause up to about 50 km): Contains a thermal inversion where temperature increases with height because the ozone layer (), concentrated at 20–30 km, absorbs solar ultraviolet radiation.
- Mesosphere (50 to 85 km): Temperatures drop to around -90°C as ozone concentrations decline. It is the coldest atmospheric layer.
- Thermosphere (85 to 600 km): Temperatures rise above 1,000°C because sparse gas molecules absorb incoming solar X-rays and short-wave ultraviolet radiation.
Oceanic Composition and Structure
Oceans cover 71% of Earth's surface and contain 97% of its free water. Seawater is about 96.5% pure water and 3.5% dissolved substances. Of the dissolved salts, roughly 85% is sodium chloride (). Average ocean salinity is 35 parts per thousand (ppt). Salinity rises where evaporation is high (e.g. the Red Sea at 40 ppt) and drops where rivers or melting ice supply fresh water (e.g. the Baltic Sea at under 10 ppt).
Dissolved gases include oxygen, which dissolves more readily in cold polar waters, and carbon dioxide. The oceans act as a major carbon sink, having absorbed roughly a quarter of anthropogenic , which causes ocean acidification.
The vertical water column consists of three primary zones:
- Surface mixed layer (0–200 m): Wind-stirred, warm, and sunlit (euphotic zone), supporting marine photosynthesis.
- Thermocline (200–1,000 m): A transitional zone where temperature drops sharply and water density increases rapidly.
- Deep ocean (1,000 m to seabed): Cold (1°C to 4°C), uniform, dark, and dense, holding roughly 90% of ocean volume.
2. Meteorological and Oceanographic Observation (9.1 & Skills)
Atmospheric and oceanic conditions are recorded systematically using surface stations, marine instruments, and satellites.
Weather Instruments
- Air Temperature: Measured in degrees Celsius (°C) using thermometers and thermistors housed in a Stevenson screen—a white, double-louvred wooden box raised 1.25 m above grass to shield instruments from direct sunlight while allowing air to circulate freely.
- Atmospheric Pressure: Measured in hectopascals (hPa) or millibars (mb) using mercury or aneroid barometers. Mean sea-level pressure is 1013.25 hPa.
- Wind Speed and Direction: Speed is measured by cup anemometers (in km/h or knots); direction is measured by wind vanes, indicating the compass direction from which the wind blows.
- Humidity: Measured using wet-and-dry bulb psychrometers or electronic hygrometers.
- Precipitation: Measured in millimetres (mm) using standard rain gauges placed in open ground.
Measuring the Oceans
- Sea Surface Temperature (SST): Recorded by thermistors on moored data buoys (such as Met Éireann's M-buoy network) and infrared radiometers on satellites.
- Salinity: Measured via electrical conductivity using a CTD probe (Conductivity, Temperature, Depth) lowered from research ships like the RV Celtic Explorer.
- Deep Temperature and Salinity: Monitored globally by the Argo float array—thousands of robotic profiling floats that drift at 2,000 m, surface every 10 days to transmit data via satellite, and descend again.
- Ocean Currents and Sea Level: Currents are tracked using satellite altimeters and drifting drifters; sea levels are monitored by coastal tide gauges.
Synoptic Chart Interpretation
A synoptic chart records atmospheric observations across a wide area at a single time. Isobars are lines connecting points of equal atmospheric pressure, drawn at 4 hPa intervals. Closely spaced isobars show a steep pressure gradient and strong winds; wide spacing shows light winds. In the Northern Hemisphere, winds blow anticlockwise into a depression (low pressure) and clockwise out of an anticyclone (high pressure). When wind direction changes clockwise, it is said to veer (e.g. south-westerly to north-westerly); when it changes anticlockwise, it is said to back.
3. The Global Heat Budget and Temperature Controls (9.2)
Shortwave solar insolation powers Earth's climate system. The heat budget represents the balance between incoming solar energy and outgoing terrestrial longwave infrared radiation.
The Global Heat Budget (100 Units of Insolation)
- Planetary Albedo (~30 units reflected): 20 units reflected by clouds, 6 units scattered back into space by atmospheric aerosols, and 4 units reflected by high-albedo surfaces like ice sheets and snow.
- Atmospheric Absorption (~19 units): Absorbed directly by clouds, dust, water vapour, and stratospheric ozone.
- Surface Absorption (~51 units): Absorbed by landmasses and oceans, warming the planet's surface.
The surface re-radiates this absorbed energy as longwave infrared radiation. Natural greenhouse gases (water vapour, carbon dioxide, and methane) absorb outgoing radiation and re-radiate it back toward Earth, keeping global mean surface temperatures around +15°C instead of a barren -18°C.
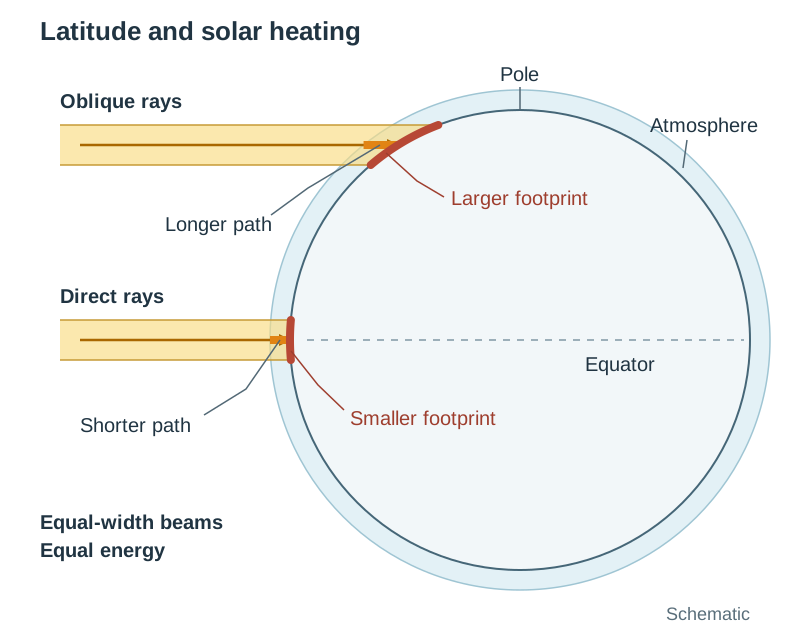
Because of Earth's shape, latitudes between 0° and 38° run a net radiation surplus, receiving direct, concentrated insolation. Latitudes poleward of 38° run a net radiation deficit because the sun strikes at an oblique angle across a larger area, traversing more atmosphere, and encountering high-albedo polar ice. Planetary winds carry 75% to 80% of surplus heat poleward, while ocean currents transfer the remaining 20% to 25%.
Five Regional Temperature Controls
- Latitude: Dictates solar angle, daylight duration, and base insolation.
- Differential Heating of Land and Sea: Water has a high specific heat capacity, warms and cools slowly, transmits heat downward, and loses energy through evaporation. Land has a low specific heat capacity and heats or cools about four times faster. Continental interiors suffer extreme seasonal temperature swings (e.g. Moscow averages -10°C in January and +20°C in July, a range of 30°C). Coastal margins experience stable maritime climates (e.g. Valentia Island, Co. Kerry has an annual range of only 9°C).
- Ocean Currents: Warm currents raise coastal winter temperatures (the North Atlantic Drift keeps Ireland 8°C–10°C milder than Labrador at the same latitude).
- Prevailing Winds: Ireland's prevailing south-westerly winds import mild, moisture-laden Atlantic air.
- Altitude: Air thins and expands with height, cooling at the environmental lapse rate of 6.5°C per 1,000 m. Dublin at sea level averages 16°C in July, while the summit of Lugnaquilla (925 m) drops to roughly 10°C.
4. Atmospheric Moisture, Precipitation, and the Hydrological Cycle (9.3)
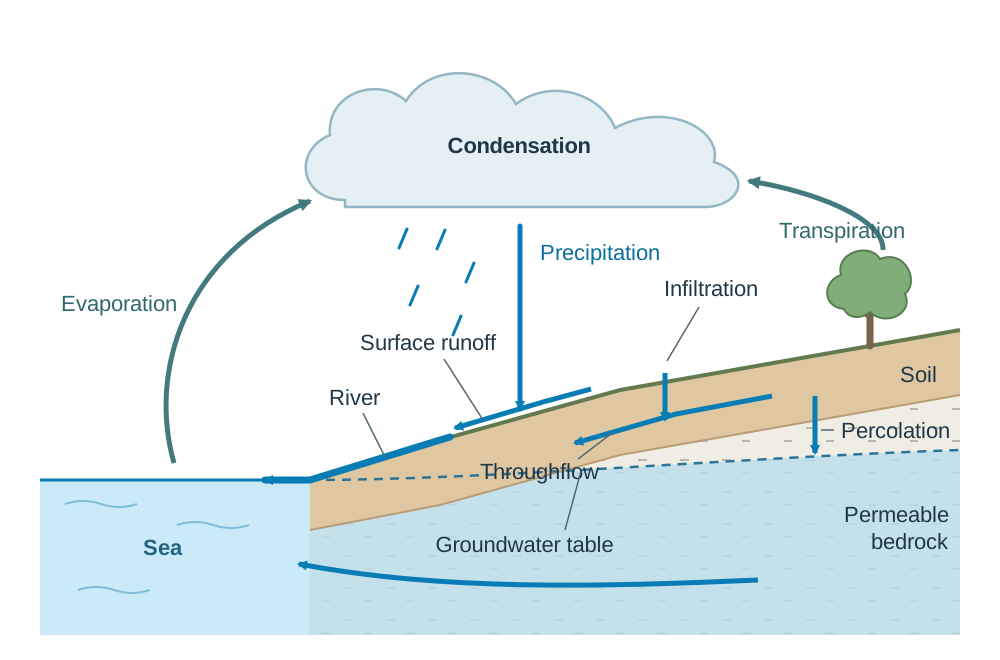
The hydrological cycle is a closed system where water circulates continuously between oceans, atmosphere, and land without overall loss. About 97% of water is stored in oceans, 2% in ice sheets, and under 1% in rivers, lakes, soil, and groundwater.
Transfers within the cycle include:
- Evaporation: Water absorbs latent heat and turns into vapour (86% originates from the oceans).
- Transpiration: Water vapour released by plant leaves; combined with evaporation as evapotranspiration.
- Condensation: Rising, cooling air reaches saturation, changing vapour back to liquid and releasing latent heat.
- Precipitation: Water returns to the surface as rain, snow, sleet, or hail.
- Infiltration and Percolation: Rainwater soaks into soil and permeable bedrock, feeding the groundwater table.
- Surface Runoff and Throughflow: Water moves overland and through soil layers into rivers and returns to the sea.
Relative Humidity and Lapse Rates
Relative Humidity (RH) expresses water vapour content as a percentage of the maximum capacity at that temperature:
When unsaturated air rises, it expands under reduced pressure and cools at the Dry Adiabatic Lapse Rate (DALR) of 10°C per 1,000 m. As it cools, its relative humidity rises until it reaches 100% saturation at its dew point. Condensation occurs on tiny airborne condensation nuclei (such as sea-salt crystals and sulphate particles), marking the cloud base. Condensation releases latent heat, which warms the parcel and lowers the cooling rate to the Saturated Adiabatic Lapse Rate (SALR) of 5°C to 6°C per 1,000 m.
Cloud Classification
- High Clouds (>6,000 m): Cirrus (wispy ice-crystal filaments), cirrostratus (thin sheets causing halos), cirrocumulus (small ripples).
- Middle Clouds (2,000–6,000 m): Altocumulus (grey rolls or patches), altostratus (dense sheets dimming the sun).
- Low Clouds (<2,000 m): Stratus (uniform, overcast grey deck giving drizzle), stratocumulus (low rounded rolls), nimbostratus (thick, dark, rain-bearing sheets).
- Clouds of Vertical Development: Cumulus (fluffy, flat-based thermal heaps), cumulonimbus (towering storm anvils up to 15 km tall).
Precipitation Types and Global Distribution
Precipitation droplets grow by colliding and merging (collision-coalescence in warm clouds; the Bergeron-Findeisen ice process in cold sub-zero clouds). The three lifting mechanisms are:
- Relief (Orographic) Rainfall: Moist Atlantic air ascends coastal mountains (e.g. MacGillycuddy's Reeks, receiving over 2,500 mm). Descending on leeward slopes, air warms adiabatically, creating a rain shadow (Dublin receives ~750 mm).
- Frontal Rainfall: Warm, buoyant air masses are lifted over denser cold air along depressions.
- Convectional Rainfall: Solar ground heating drives rapid vertical updraughts, producing afternoon cumulonimbus storms.
Global Precipitation Patterns:
- Equatorial Low (0°–10°): Very wet (>2,000 mm/year) due to intense convective uplift along the ITCZ (e.g. Manaus, Amazon Basin, ~2,300 mm).
- Subtropical Highs (20°–30° N/S): Arid (<250 mm/year); subsiding, warming air suppresses clouds, creating the Sahara and Atacama deserts.
- Mid-Latitudes (40°–60°): Secondary wet belt (800–2,000 mm/year) fed by frequent frontal depressions along the polar front.
- Polar Regions (>70°): Cold deserts (<250 mm/year); frigid air holds negligible water vapour.
5. Atmospheric Circulation Cells, Ocean Gyres, and the AMOC (9.4)
Three forces govern the circulation of air and water: the pressure gradient force (drives fluids from high to low pressure), the Coriolis effect (deflects moving fluids to the right in the Northern Hemisphere and to the left in the Southern Hemisphere), and friction with Earth's surface.
The Three-Cell Atmospheric Model
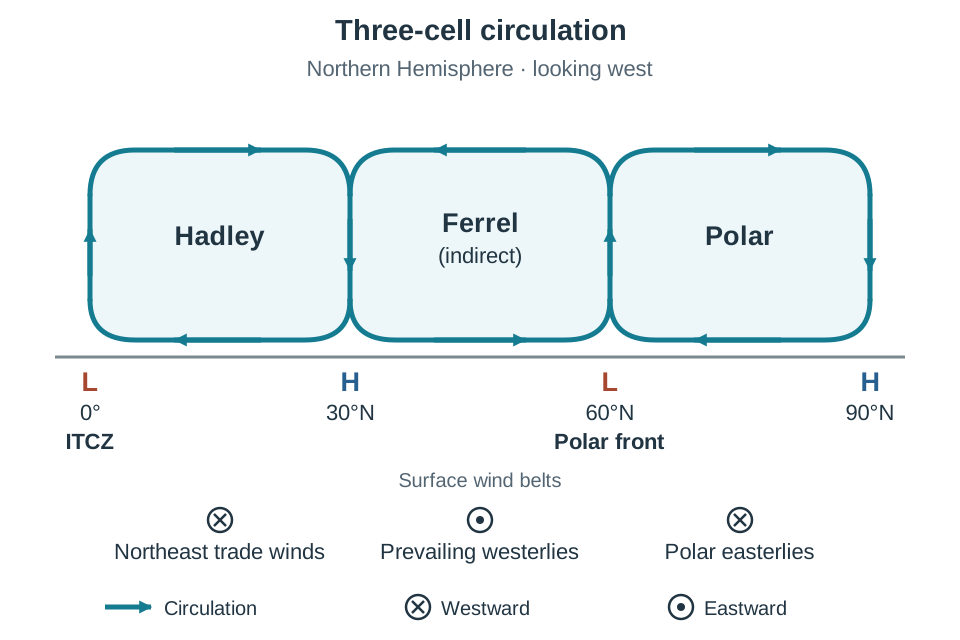
Heat is moved polewards by three large circulation cells in each hemisphere:
- Hadley Cell (0° to 30°): Direct insolation causes air to rise at the low-pressure Intertropical Convergence Zone (ITCZ). This air travels poleward at altitude, cools, and sinks around 30° latitude, forming the Subtropical High-Pressure Belts. Sinking air warms adiabatically and dries out, creating world deserts. Returning surface air is deflected by Coriolis into the Northeast and Southeast Trade Winds.
- Polar Cell (60° to 90°): Frigid, dense air subsides at the poles, creating high pressure, and flows equatorward at the surface as the cold Polar Easterlies.
- Ferrel Cell (30° to 60°): The Ferrel cell is not driven by heating from below like the other two. It is dragged round mechanically, like a gear turning between the Hadley cell on one side and the Polar cell on the other. Surface air migrating poleward from the subtropical high is deflected to form the Prevailing Westerlies. At roughly 50°–60° latitude, warm westerlies meet cold polar easterlies at the polar front, forcing air upward into low-pressure depressions.
Surface Ocean Circulation: The North Atlantic Gyre
Prevailing winds drag surface ocean waters (the upper 400 m, representing 10% of ocean volume), while Coriolis deflection and continental barriers bend these flows into circular loops called gyres (clockwise in the Northern Hemisphere). The North Atlantic Gyre comprises four connected currents:
- The warm North Equatorial Current, pushed westward by the trade winds.
- The Gulf Stream, a narrow, rapid, warm western-boundary current carrying tropical heat northward along North America at up to 2.5 m/s.
- The North Atlantic Drift, where the Gulf Stream broadens eastwards across the Atlantic under the mid-latitude westerlies, delivering warm surface waters to Ireland and keeping ports like Killybegs, Co. Donegal, ice-free year-round.
- The cold Canaries Current, which flows southward along northwest Africa. Offshore winds push coastal water away, inducing upwelling of cold, nutrient-rich bottom waters that nourish vital fisheries.
Deep Thermohaline Circulation (The Global Conveyor Belt)
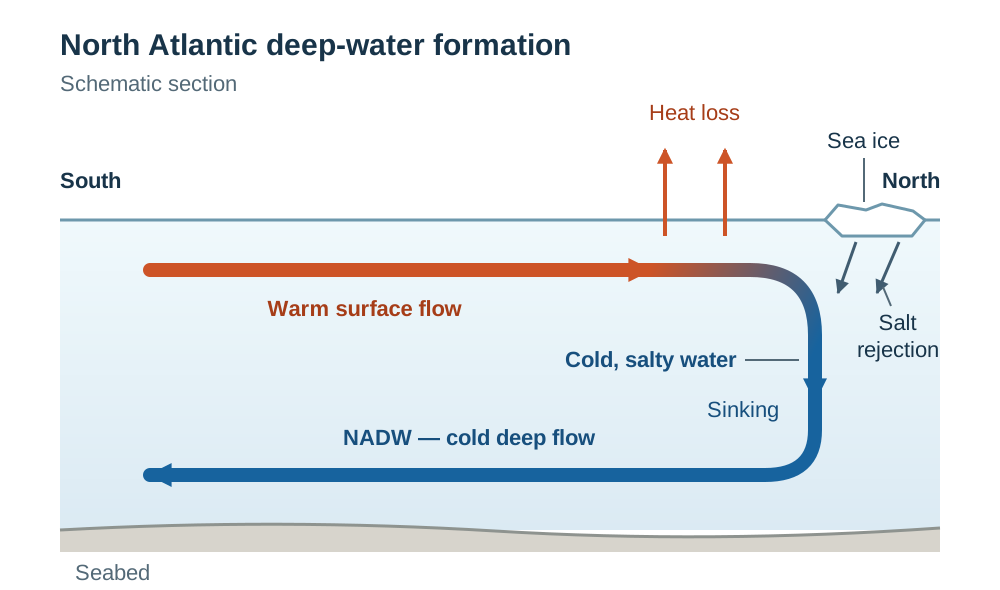
Deep ocean currents drive 90% of ocean volume through density differences caused by water temperature (thermo) and salinity (haline). In sub-polar waters off Greenland and Norway, the saline waters of the North Atlantic Drift lose heat to cold Arctic air. As sea ice forms, salt is excluded into the surrounding sea through brine rejection. The unfrozen water left behind is therefore exceptionally cold, salty and dense, and it sinks to the ocean floor in downwelling zones, forming North Atlantic Deep Water (NADW).
NADW flows southward along the Atlantic seabed into the Southern Ocean and circulates into the Pacific and Indian oceans before upwelling. This complete overturning circulation—the Atlantic Meridional Overturning Circulation (AMOC)—takes roughly 1,000 years to cycle and is a primary stabilizer of northwest Europe's climate.
6. Air Masses, Weather Systems, Jet Streams, and Local Winds (9.4)
An air mass is a large body of air with uniform temperature and moisture characteristics acquired from its source region.
Air Masses Affecting Ireland
- Tropical Maritime (Tm): Originates over the warm sub-tropical Atlantic (south-west). Brings mild, damp, cloudy conditions with drizzle and hill fog; the most common air mass over Ireland.
- Polar Maritime (Pm): Originates over the cold North Atlantic (north-west). Brings cool, fresh conditions with cumulus clouds, bright sunshine, and heavy showers.
- Arctic Maritime (Am): Originates over the Arctic ice cap (north). Brings bitter cold, severe frost, and winter snow showers on northern coasts.
- Tropical Continental (Tc): Originates over North Africa and southern Europe (south-east). Brings hot, dry, sunny summer weather and heatwaves.
- Polar Continental (Pc): Originates over eastern Europe and Siberia (east). Brings bitterly cold, dry winter conditions with severe frosts and eastern snow showers.
The Polar Front Jet Stream
The jet stream is a narrow ribbon of fast wind (160–400 km/h) in the upper troposphere, 9–12 km up, flowing west to east above the polar front. It forms because of the sharp temperature and pressure contrast between polar and tropical air masses. The jet stream steers Atlantic depressions across Ireland. When a meander of the jet stream stalls, a blocking anticyclone forms, diverting depressions away and locking settled weather (summer heatwaves or winter freezes) in place for weeks, as occurred in the drought of June–July 2018.
Mid-Latitude Depressions
A mid-latitude depression develops along the polar front as a wave in four stages:
- Wave Formation: A kink forms on the polar front; central barometric pressure falls below 1,000 hPa as air converges anticlockwise.
- Frontal Structure: The leading edge is the warm front (gentle 1:100 slope), where Tm air slides over cold air, producing high cirrus clouds that thicken into cirrostratus, altostratus, and nimbostratus, delivering prolonged, steady rain. In the warm sector, temperatures rise, winds veer south-westerly, and rain turns to drizzle. The trailing cold front (steep 1:50 slope) violently undercuts the warm sector, forcing rapid ascent that creates towering cumulonimbus clouds, squally downpours, lightning, and hail, followed by winds veering north-westerly and sharply falling temperatures.
- Occlusion: The faster-moving cold front catches the warm front, lifting the warm sector off the ground to form an occluded front.
- Dissipation: Temperature contrasts disappear, pressure rises, and the storm dissipates (e.g. Storm Babet in October 2023, which dropped over 90 mm of rain and flooded Midleton, Co. Cork).
Local Winds and Thunderstorms
- Land and Sea Breezes: Caused by daily differences in heating between land and sea. On a hot, calm summer afternoon in Dublin Bay, the land heats faster than the sea, creating a local low; a cooling onshore sea breeze develops by early afternoon, leaving coastal Dublin 3°C–4°C cooler than inland suburbs. At night, rapid terrestrial radiation makes the land colder than the sea, generating a weak offshore land breeze.
- Mountain and Valley Winds: By day, mountain slopes warm, generating an upslope anabatic wind. By night, rapid cooling drains dense cold air into valley floors as a downslope katabatic wind, frequently creating valley frost hollows and temperature inversions (e.g. Glendalough, Co. Wicklow).
- Thunderstorms: Strong surface heating triggers powerful updraughts (cumulus stage). In the mature stage, a towering cumulonimbus cloud reaches the tropopause, containing both updraughts and rain-cooled downdraughts, producing lightning, thunder, and torrential rain. In the dissipating stage, downdraughts choke the rising updraughts and the storm decays.
7. Climatic Environments and Long- and Short-Term Climate Change (9.5)
Distinctive Global Climate: The Equatorial Rainforest Climate (Af)
Found within 5° to 10° of the equator across the Amazon Basin, Congo Basin, and Southeast Asia:
- Temperature: High and stable monthly means (26°C–28°C) year-round due to direct, perpendicular insolation and 12-hour days. There is no seasonal winter. The annual temperature range is under 3°C, but the diurnal temperature range is 6°C–8°C.
- Precipitation: High annual rainfall (2,000–3,500 mm) spread across more than 200 wet days. Convective rainfall dominates: intense morning sunshine drives rapid evaporation and transpiration, producing afternoon cumulonimbus storms around 3 to 4 pm.
- Controls: Dominated year-round by the low-pressure ITCZ. Dense rainforest canopies sustain heavy evapotranspiration, recycling over 50% of basin moisture locally.
Natural Climate Change: Milankovitch Cycles and Past Evidence
Past climates are reconstructed using multiple scientific sources:
- Ice Cores: Antarctic and Greenland cores over 3 km deep preserve trapped atmospheric bubbles (giving direct records) and oxygen isotope ratios () that indicate ocean temperatures over the past 800,000 years.
- Ocean Sediment Cores: Fossil foraminifera shells record past water temperatures and ice volume.
- Dendrochronology (Tree Rings) and Bog Pollen: Annual ring widths and pollen preserved in Irish peat bogs reflect past growing conditions and forest composition changes.
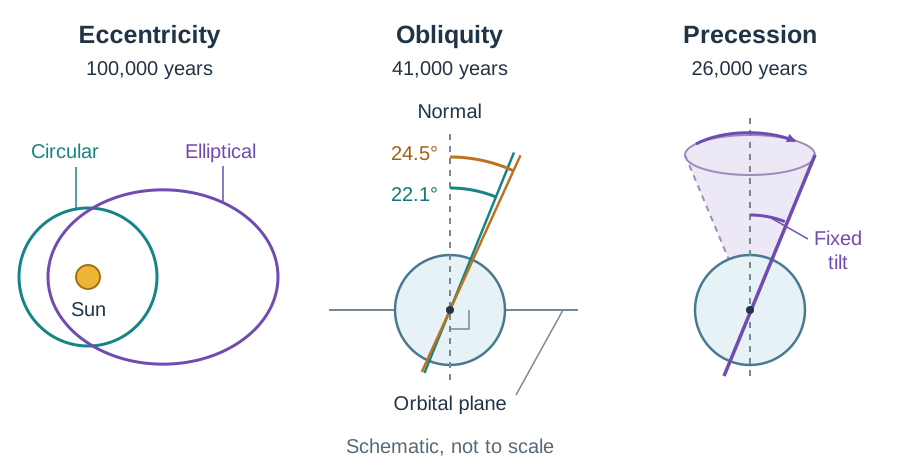
During the Pleistocene Epoch (2.6 million to 11,700 years ago), glacial and interglacial cycles were triggered by three orbital Milankovitch cycles:
- Eccentricity (100,000-year cycle): Earth's orbit shifts between circular and elliptical.
- Obliquity / Axial Tilt (41,000-year cycle): Tilt shifts between 22.1° and 24.5° (currently 23.5°); lower tilt cools high-latitude summers, allowing winter snow to survive and build ice sheets.
- Precession (26,000-year cycle): The rotational axis wobbles, altering the timing of seasons relative to orbital perihelion.
Anthropogenic Global Warming and Irish Impacts
Atmospheric has climbed from a pre-industrial 280 ppm to over 420 ppm due to fossil fuel burning, deforestation, and industrial agriculture. Global mean surface temperatures have risen by 1.1°C above the 1850–1900 baseline, causing Arctic sea ice to decline by roughly 13% per decade and global sea level to rise by 3.7 mm/year.
Impacts on Ireland:
- Mean temperatures have risen by ~0.9°C since 1900, lengthening the agricultural growing season.
- Sea-level rise (3–4 mm/year) accelerates coastal erosion on soft eastern cliffs and elevates tidal flood risks in Cork city, Dublin, and Limerick.
- Warmer seas inject more latent heat into Atlantic depressions, worsening windstorms and heavy winter rainfall events that cause river flooding in the Shannon basin.
Responses: The international Paris Agreement (2015) aims to restrict warming to well below 2°C (targeting 1.5°C). Ireland's Climate Action Plan targets a 51% emissions cut by 2030 and net zero by 2050, though agriculture produces over a third of national emissions, primarily methane from livestock.
Short-Term Coupled Climate Disruption: El Niño (ENSO)
Operating on a 2- to 7-year cycle in the equatorial Pacific:
- Normal Walker Circulation: Strong easterly trade winds pile warm water into the Western Pacific Warm Pool near Indonesia (>28°C), driving low pressure and heavy convective rain. Along Peru, offshore winds trigger coastal upwelling of cold, nutrient-rich water, feeding prolific anchoveta fisheries.
- El Niño Phase: Trade winds weaken or reverse into westerlies. The warm pool flows east toward South America, raising Peruvian coastal sea surface temperatures by 2°C–4°C. This warm cap shuts off nutrient upwelling, collapsing Peruvian fisheries. Convective rainfall shifts east, causing catastrophic flooding along coastal Peru and Ecuador, while triggering severe drought and bushfires across Australia and Indonesia.
8. Climate Characteristics and Economic Development (9.6)
1. Agriculture and Domestic Water Supply in Ireland
- Pastoral Farming: Mild winters (4°C–7°C) and cool summers (14°C–16°C) keep temperatures above the 6°C threshold for grass growth for 280–300 days a year in southern and western Ireland. Cattle graze outdoors for 9 to 10 months, drastically lowering winter housing costs. This climate supports an agri-food export industry worth roughly €17 billion annually (Bord Bia), with dairy contributing €6 billion and beef €3 billion. Around 90% of Irish beef and dairy output is exported.
- Arable Tillage: High western rainfall (roughly 1,200–1,400 mm across the western lowlands, rising to over 2,000 mm on western mountains) leaches soil nutrients and waterlogs land. Tillage farming (barley, wheat) is concentrated in the drier, sunnier south-east (Wexford, Carlow, Kilkenny), which receives 750–900 mm of rain and over 1,500 annual sunshine hours.
- Domestic Water Supply: Over 80% of drinking water is drawn from surface sources (rivers, lakes, and reservoirs like Poulaphouca Reservoir in Co. Wicklow, which supplies the Greater Dublin Area). A geographical mismatch exists: 70% of precipitation falls in the sparsely populated west, while maximum demand is in the dry east. During summer anticyclones (such as the 2018 drought, when Shannon reached 32.0°C), reservoir levels collapse, forcing national hosepipe bans. Distribution networks lose almost 50% of treated water through leaks, prompting plans for a 170 km pipeline to transfer 330 million litres daily from the River Shannon to Dublin.
2. Drought and Desertification in the African Sahel
The Sahel is a 5,400 km semi-arid belt south of the Sahara receiving 200–600 mm of erratic summer rain, followed by the dry, dusty Harmattan wind from the north-east.
- Causes of Desertification: Temperatures have climbed by 0.5°C–1.5°C over the past century. Rapid population growth has expanded cattle herds, leaving 70% of rangelands overgrazed. Deforestation for fuelwood and overcultivation strip protective vegetation. Wind and flash rains strip topsoil, lowering water tables by up to 2 m annually. Over 45% of Sahelian land and 80% of farmlands are degraded, causing crop failure, famine, and migration.
- Responses: The African Union's Great Green Wall aims to establish an 8,000 km vegetation barrier across Africa. Farmers employ traditional zaï pits (planting pits that trap runoff and organic compost) and stone contour bunds to restore degraded topsoil.
3. Climate and International Tourism: Spain
Spain's Mediterranean climate (Csa) offers hot, dry summers (28°C–35°C), mild winters, and over 300 sunny days annually, driving coastal tourism in the Costa del Sol, Costa Brava, and Balearic Islands.
- Economic Value: Spain received roughly 71.7 million international tourists in 2022, rising to 85 million in 2023, making it the second most visited country in the world. Tourism generates over 12% of Spanish GDP and supports 2.5 million jobs.
- Vulnerabilities: Summer heatwaves exceeding 40°C in Andalusia create severe heat stress and deter peak-season visitors. Drought depletes municipal reservoirs, sparking conflict between tourist consumption (swimming pools, golf courses) and agricultural irrigation. In the Pyrenees, rising winter temperatures reduce natural snow cover, forcing costly artificial snowmaking.
9. Key Statistics and Diagrams to Learn
Statistics You Must Be Able to Quote
- Environmental Lapse Rate (ELR): 6.5°C per 1,000 m (0.65°C / 100 m)
- Dry Adiabatic Lapse Rate (DALR): 10°C per 1,000 m (1.0°C / 100 m)
- Saturated Adiabatic Lapse Rate (SALR): 5°C to 6°C per 1,000 m
- Standard Sea-Level Pressure: 1013.25 hPa (mb)
- Planetary Albedo: ~30% (surface absorption is ~51%, atmospheric absorption is ~19%)
- Average Ocean Salinity: 35 ppt (35 g of salt per 1 kg of seawater)
- Atmospheric : Pre-industrial 280 ppm over 420 ppm today
- Global Mean Warming: ~1.1°C above pre-industrial levels; sea-level rise ~3.7 mm/year
- Irish Climate Benchmarks: Growing season 280–300 days in south-west; Dublin rainfall ~750 mm vs. western mountains >2,500 mm
Eight Key Labelled Diagrams for Option 9
A correctly drawn, fully labelled diagram can earn significant marks in an 80-mark Option essay:
- Vertical Structure of the Atmosphere: Height axis 0–100 km, temperature axis, four layers (troposphere, stratosphere, mesosphere, thermosphere), tropopause, and ozone layer at 20–30 km.
- The Global Heat Budget: Insolation arrow (100 units), 30 units reflected (albedo), 19 absorbed by atmosphere, 51 absorbed at surface, and longwave terrestrial radiation.
- Three-Cell Global Circulation: Cross-section showing Hadley, Ferrel, and Polar cells; ITCZ at equator; subtropical highs at 30°; polar front at 60°; surface trade winds, westerlies, and polar easterlies.
- North Atlantic Gyre: Clockwise loop showing the North Equatorial Current, Gulf Stream, North Atlantic Drift, and Canaries Current, with Ireland and the upwelling zone marked.
- Mid-Latitude Depression Cross-Section: Warm front on the right (gentle slope, cirrus altostratus nimbostratus), warm sector, cold front on the left (steep slope, towering cumulonimbus), cold air wedges, and rain belts.
- Relief Rainfall and Rain Shadow: Air forced up windward slope, condensation level, heavy cloud and rain, descending warming air on leeward side, and dry rain shadow.
- Land and Sea Breezes: Daytime sketch showing warm land, local low, cool sea, and onshore breeze; night-time sketch showing cold land, local high, and offshore breeze.
- Walker Circulation vs. El Niño: Equatorial Pacific cross-sections showing normal conditions (strong easterly trade winds, warm pool west, cold upwelling off Peru) contrasted with El Niño (weakened trades, warm water surging east, suppressed upwelling).
Key terms
- Albedo
- The percentage of incoming solar radiation reflected back into space by a surface without heating it; Earth's planetary albedo averages about 30%.
- Environmental Lapse Rate (ELR)
- The rate at which the temperature of the surrounding, still air falls as you climb through the troposphere, averaging 6.5°C for every 1,000 metres.
- Dry Adiabatic Lapse Rate (DALR)
- The rate at which an unsaturated, rising air parcel cools internally through expansion, exactly 10°C per 1,000 metres (1°C per 100 metres).
- Saturated Adiabatic Lapse Rate (SALR)
- The rate at which a saturated, rising air parcel cools once condensation begins, averaging 5°C to 6°C per 1,000 metres due to the release of latent heat.
- Dew Point
- The temperature to which an air parcel must cool for it to reach 100% relative humidity, initiating condensation.
- Condensation Nuclei
- Microscopic airborne particles (such as sea-salt crystals, dust, and sulphate aerosols) onto which atmospheric water vapour condenses to form cloud droplets.
- Coriolis Effect
- The apparent deflection of moving air and water caused by Earth's rotation, turning paths to the right in the Northern Hemisphere and to the left in the Southern Hemisphere.
- Intertropical Convergence Zone (ITCZ)
- The equatorial low-pressure trough where the Northeast and Southeast Trade Winds converge, driving powerful convective updraughts and heavy rainfall.
- Polar Front
- The dynamic boundary zone near 60° latitude where cold polar easterly air masses meet and clash with warm subtropical westerly air masses.
- Thermohaline Circulation
- The global, deep-ocean conveyor-belt circulation driven by water density differences that result from variations in ocean water temperature (thermo) and salinity (haline).
- Upwelling
- The vertical ascent of cold, dense, and nutrient-rich deep ocean water to the surface layer, typically triggered where surface winds push coastal water offshore.
- Air Mass
- A large body of air with roughly uniform temperature and humidity throughout, acquired from the regional surface over which it formed.
- El Niño Southern Oscillation (ENSO)
- A recurring 2-to-7-year climatic oscillation involving the breakdown of equatorial Pacific trade winds, the eastward spread of warm surface waters, and the suppression of cold upwelling along Peru.
- Milankovitch Cycles
- Long-term variations in Earth's orbital geometry—specifically eccentricity, obliquity (axial tilt), and precession—that alter the latitudinal and seasonal distribution of solar insolation over tens of thousands of years.
- Rain Shadow
- A dry area on the leeward side of an elevated mountain barrier where descending air warms and dries adiabatically, suppressing cloud formation and rainfall.
- Desertification
- The persistent degradation of productive dryland ecosystems into non-productive desert due to climate variability and human overexploitation.
Check yourself
Name the four thermal layers of the atmosphere in order from Earth's surface outward, and state which layer contains the ozone layer.
Troposphere, stratosphere, mesosphere, and thermosphere. The ozone layer is located in the stratosphere (at approximately 20 to 30 km altitude).
What are the three headline figures of Earth's global heat budget for incoming solar insolation (100 units)?
Roughly 30 units are reflected directly back to space (planetary albedo), 19 units are absorbed by the atmosphere and clouds, and 51 units are absorbed at Earth's surface.
Explain the role of latent heat in the hydrological cycle and depression systems.
Water absorbs latent heat when evaporating from the oceans. When this rising vapour condenses into clouds, it releases that stored latent heat into the atmosphere, providing the thermal energy that fuels mid-latitude depressions and thunderstorms.
Name the five distinct air masses that affect weather over Ireland.
Tropical Maritime (Tm), Polar Maritime (Pm), Arctic Maritime (Am), Tropical Continental (Tc), and Polar Continental (Pc).
Describe the sequence of clouds and precipitation as a warm front, followed by a cold front, passes over Ireland.
Ahead of the warm front: high cirrus thickens to cirrostratus, altostratus, and nimbostratus, giving prolonged, steady rain. In the warm sector: temperatures rise and rain eases to drizzle. As the cold front hits: towering cumulonimbus clouds produce sudden, intense squally downpours and hail, followed by clearing skies, a wind veer, and a sharp drop in temperature.
What physical process drives North Atlantic Deep Water (NADW) formation near Greenland and Norway?
Cold winds chill the saline water of the North Atlantic Drift, and freezing sea ice expels dissolved salts through brine rejection. The remaining unfrozen water becomes extremely cold, salty, and dense, causing it to sink to the ocean floor in downwelling zones.
Give two climatic reasons why arable tillage farming in Ireland is concentrated in the south-east rather than the west.
The south-east receives lower annual rainfall (750–900 mm compared to roughly 1,200–1,400 mm across the western lowlands and over 2,000 mm on western mountains), preventing waterlogged soils and nutrient leaching, and it receives over 1,500 hours of annual sunshine (5–7 hours daily in summer), which is required to ripen grain crops.
Name two methods scientists use to reconstruct Earth's past climate conditions before instrument records began.
Analysing trapped gas bubbles and oxygen isotope ratios in polar ice cores (from Antarctica and Greenland), and studying the growth rings of ancient preserved trees (dendrochronology) or pollen types in peat bogs.
What is the difference between a wind that 'veers' and a wind that 'backs'?
A veering wind changes its direction in a clockwise manner (e.g. from south-westerly to north-westerly), whereas a backing wind changes its direction in an anticlockwise manner (e.g. from south-westerly to south-easterly).