

Elective Unit 5 examines the dynamics of human populations and settlements across space and time for the Leaving Certificate Higher Level examination. The unit covers population distribution, density metrics, demographic transition, theories of overpopulation, vital rates, and the causes, policies, and consequences of migration. It also investigates rural settlement evolution, central place hierarchy, internal urban land-use models, changing urban functions, heritage, traffic, decay, renewal, developing-world urbanisation, and sustainable planning for cities of the future.
How the Human Elective is Examined and Core Skills
In Part Two, Section 2 of the Higher Level examination paper, you must answer one question from Questions 10, 11, and 12. Each question is worth 80 marks and follows a three-part structure:
- Part A (20 marks): A stimulus-based data-response question using a population pyramid, migration graph, density table, Ordnance Survey (OS) map, aerial photograph, or land-use diagram. It consists of short objective and explanatory sub-parts.
- Parts B and C (30 marks each): Developed written answers marked according to Significant Relevant Points (SRPs). Each SRP is an accurate, factual statement, specific statistic, named geographic feature, or cause-and-effect link. Each standard SRP earns 2 marks, meaning you need roughly 15 SRPs per part. A named case study or example is typically worth the first 2 marks.
Examination Timing and Command Words
Allocate approximately 35 minutes to the elective question: 8 minutes for Part A and 13 to 14 minutes each for Parts B and C.
| Command Word | What the Examiner Expects |
|---|---|
| Name / State | Give the factual answer or figure directly; no explanation is required. |
| Explain briefly | State a clear point and develop it in a second sentence (normally marked as 2+2 marks). |
| Describe | Provide details of what a feature looks like, its stages, or how an event unfolded. |
| Explain | Give reasons why a pattern exists, connecting causes to effects using connective phrasing. |
| Examine / Discuss | Analyse multiple aspects of a topic, addressing both sides or causes and effects evenly. |
| Assess / Evaluate | Present a clear evaluative judgement backed by evidence, examining both successes and limitations. |
Diagram Drawing Guide (Skills Requirement)
A relevant, clearly labelled diagram can earn SRPs in Parts B and C. Five diagrams are especially useful in this unit:
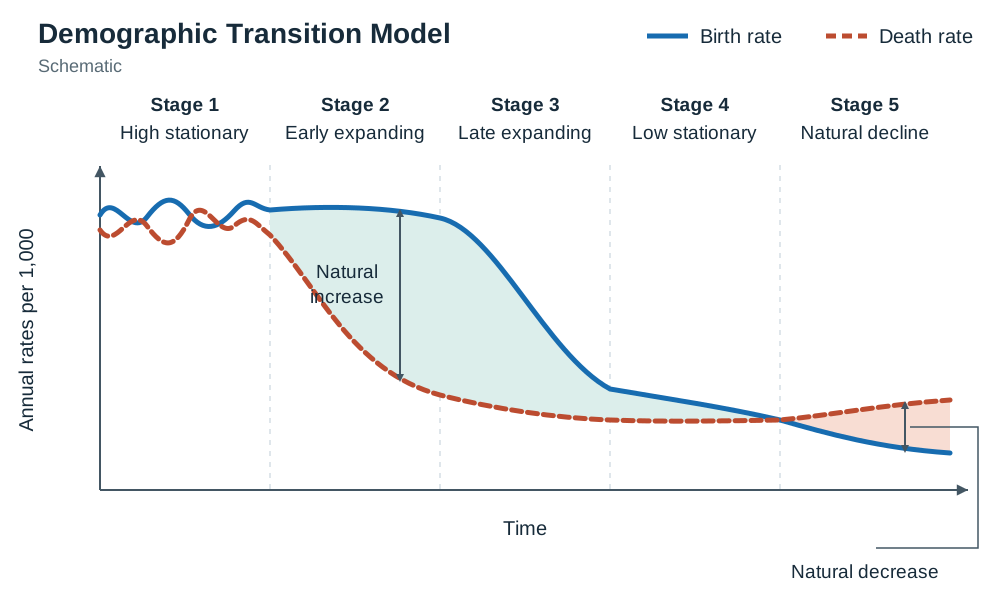
- Demographic Transition Model (DTM): Plot time along the horizontal axis and rate per 1,000 on the vertical axis. Draw the birth-rate curve staying high before dropping in Stage 3, and the death-rate curve dropping steeply in Stage 2. Shade the gap between them and label it natural increase. Rule off and label all five stages.
- Population Pyramid: Draw vertical five-year cohort bands, placing males on the left and females on the right, with percentage or absolute numbers along the base. Label the working age (15–64) and the dependent age brackets (0–14 and 65+).
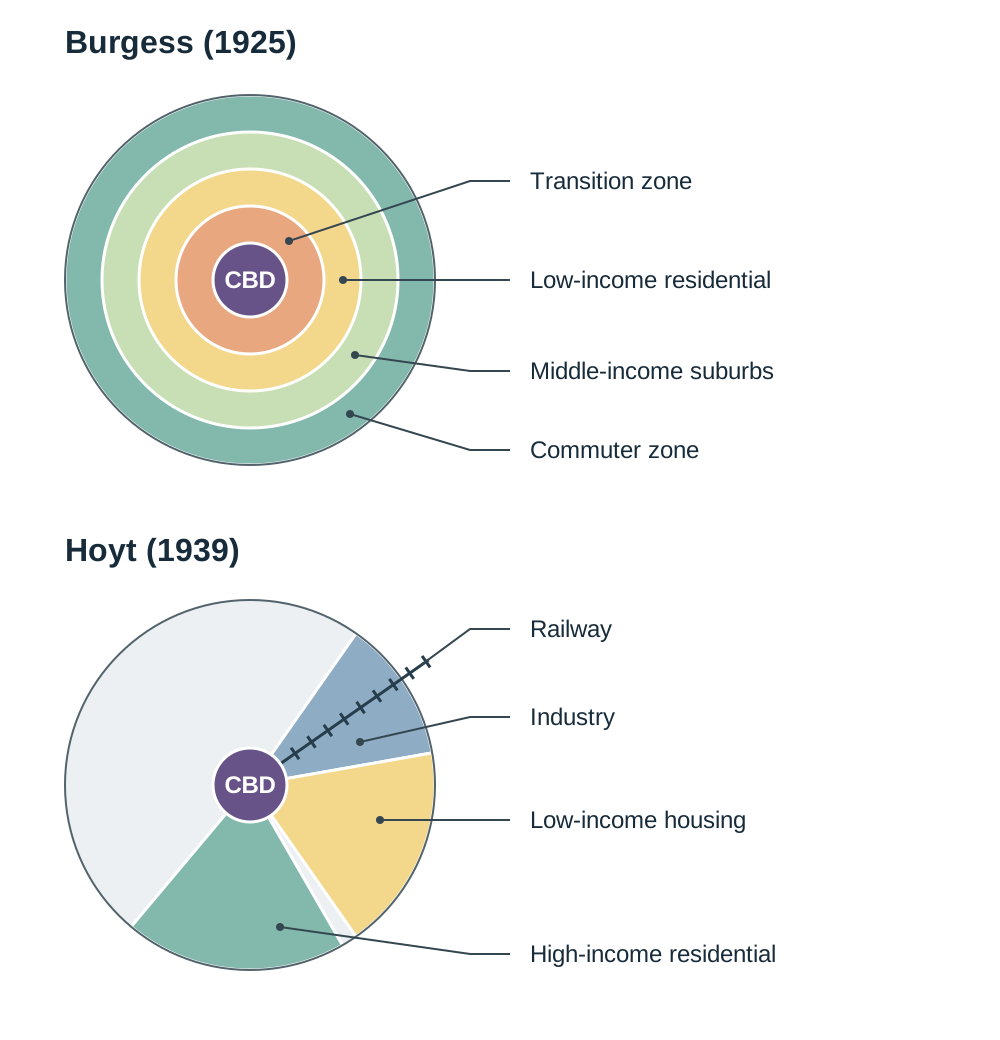
- Burgess Concentric Zone Model: Draw five concentric rings around a central circle: (1) Central Business District (CBD), (2) Transition Zone, (3) Low-income residential, (4) Middle-income suburbs, (5) Commuter zone.
- Hoyt Sector Model: Draw the central CBD with wedge-shaped sectors radiating outward along transport corridors (railway lines, river valleys, arterial highways) rather than neat circles.
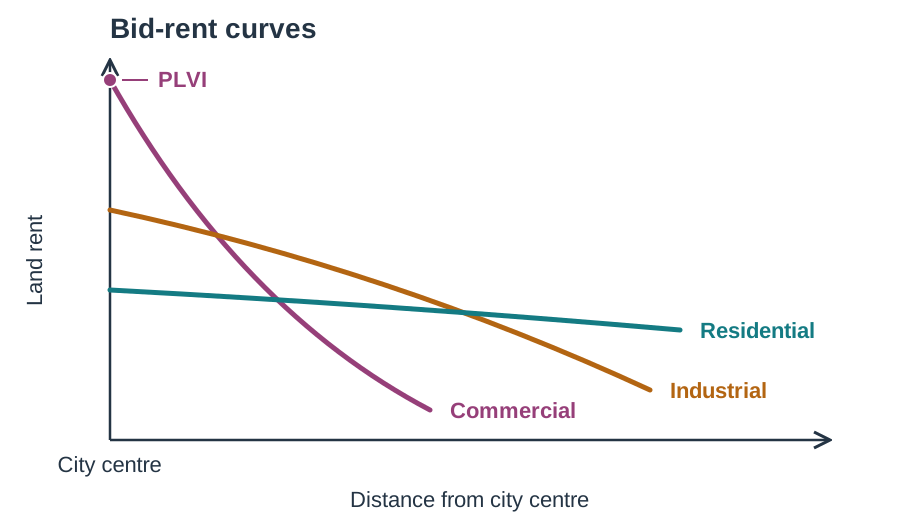
- Bid-Rent Theory Curve: Place distance from city centre on the horizontal axis and land rent on the vertical axis. Draw three intersecting downward-sloping curves: commercial (steepest), industrial, and residential (flattest). Label the origin as the Peak Land Value Intersection (PLVI).
Population Distribution, Density, and Vital Rates
Population distribution describes the spatial spread of people across an area, highlighting regions of concentration and sparsity. Population density measures how crowded an area is, expressed as the average number of people per unit of land area.
Arithmetic density can mask severe land pressure. Ireland has an arithmetic density of approximately 73 people per km² based on Census 2022 data (5,149,139 people across 70,273 km²). In contrast, physiological density divides total population by the area of farmable land, highlighting the actual pressure on food-producing capacity. Egypt is the classic global example: while its arithmetic density appears moderate, over 95% of its population lives on the roughly 5% of land comprising the Nile Valley and Delta, giving it an exceptionally high physiological density.
Physical Factors Influencing Distribution
- Relief: Lowland plains simplify the construction of roads, railways, and settlements. Globally, over 80% of people live below 500 metres altitude, such as on the North European Plain. Steep uplands, including the Alps and the western uplands of Ireland, restrict farming due to thin soils, steep slopes, and harsh microclimates.
- Climate: Roughly 90% of humanity lives in the northern hemisphere, concentrated in temperate latitudes between 20°N and 60°N. Hyper-arid deserts (the Sahara) and polar regions (northern Canada, Antarctica) restrict farming and water access.
- Soils and Drainage: Deep, well-drained alluvial and brown earth soils support intensive agriculture (such as the Ganges Basin). Marshy or waterlogged lands, such as western blanket bogs in Mayo or the Shannon callows, support very few people.
- Resources: Mineral and energy deposits historically attracted industrial populations, as seen in the Ruhr coalfield. However, rich deposits in harsh environments, such as iron ore in northern Sweden, support only small, isolated settlements.
Human Factors Influencing Distribution
- Historical Events: The Great Famine (1845–1852) caused approximately one million deaths and prompted over one million people to emigrate, initiating over a century of depopulation across western Ireland and dropping the island's population from 8.2 million in 1841 to 6.5 million by 1851.
- Government Policy: Deliberate planning can shift populations. Brazil founded its planned inland capital, Brasília, in 1960 to pull investment and people away from overcrowded coastal hubs like Rio de Janeiro and São Paulo.
- Socio-Economic Infrastructure: High-technology multinational corporations, financial services, and universities concentrate employment in Dublin, generating densities exceeding 4,500 people per km², while remote areas in Connemara record densities below 10 people per km².
Demographic Vital Rates
- Crude Birth Rate (CBR): Live births per 1,000 people per year.
- Crude Death Rate (CDR): Deaths per 1,000 people per year.
- Natural Increase (%): Calculated using the formula:
- Total Fertility Rate (TFR): The average number of children born to a woman during her childbearing years. A TFR of 2.1 represents replacement-level fertility, the level needed to maintain a stable population without immigration.
The Demographic Transition Model and Population Structures
The Demographic Transition Model (DTM) explains how birth and death rates evolve as a country undergoes economic, social, and technological development.
| Stage | Birth Rate | Death Rate | Natural Increase | Real-World Example |
|---|---|---|---|---|
| 1: High Stationary | High (>35/1,000) | High (>35/1,000) | Low and erratic | Pre-industrial societies (no country today) |
| 2: Early Expanding | High (>35/1,000) | Falling rapidly | Rapid population growth | Niger, Mali, Afghanistan |
| 3: Late Expanding | Falling sharply | Falling slowly | Slower population growth | India, Brazil, Mexico |
| 4: Low Stationary | Low (10–14/1,000) | Low (6–9/1,000) | Slow, stable growth | Ireland, France, USA |
| 5: Natural Decline | Very low (<9/1,000) | Low to rising (10–12/1,000) | Natural decrease | Germany, Japan, Italy |
Explaining the Rate Changes
- Why Death Rates Fall First (Stage 2): Cheap public health measures—clean piped water supplies, proper sewage disposal, boiling water, and vaccination against childhood diseases such as measles—cut the death rate long before attitudes to family size change.
- Why Birth Rates Fall Later (Stage 3): As infant mortality drops, parents realise fewer births are needed to guarantee surviving children. Improved female education and career opportunities delay marriage and childbearing. In urban industrial centres, children become an economic liability (expensive to house and educate) rather than an economic asset for farm labour.
- Stage 5 Realities: Where fertility stays below the replacement level of 2.1 children per woman for decades, the workforce shrinks. The crude death rate rises slightly because the population contains a larger proportion of elderly people reaching the end of their natural lifespans, not because healthcare has worsened.
Population Pyramids and the Dependency Ratio
Population pyramids display age cohorts stacked in five-year intervals, with males on the left and females on the right:
- Progressive (Expansive): A broad base with a rapidly tapering apex, reflecting high birth rates and high child mortality (Stage 2 nations like Niger).
- Stationary: A column-shaped structure showing balanced cohorts across childhood and working ages (Stage 4 nations like Ireland). Ireland's Census 2022 pyramid is broadly stationary, but features a narrowing base from falling births since 2010 and a distinct bulge in the 35–44 age bracket, reflecting the ageing of the Celtic Tiger generation.
- Regressive (Contracting): An urn-like profile where the base is noticeably narrower than the middle-aged cohorts, reflecting an ageing population and sustained low birth rates (Stage 5 nations like Japan and Germany).
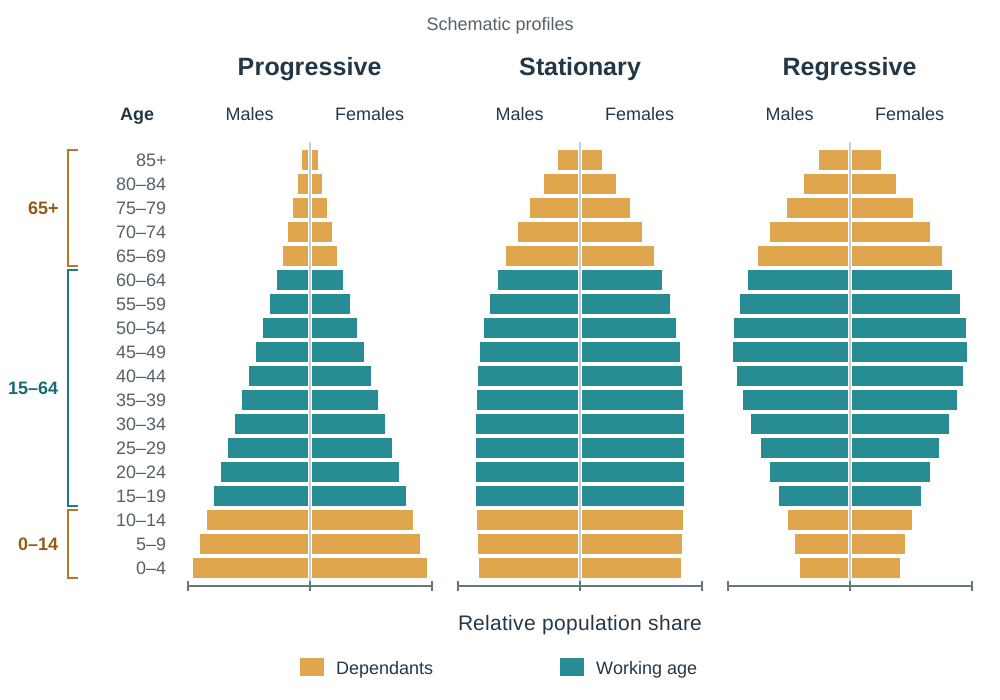
In Census 2011, Ireland had 979,590 children, 535,393 elderly people, and 3,073,269 working-age adults, yielding a dependency ratio of 49.3 dependants per 100 workers. By Census 2022, the proportion aged 65 and over rose to 15%, increasing state expenditure on pensions and geriatric healthcare while placing a heavier tax burden on the working population.
Overpopulation, Theories, and Resources: The Sahel Case Study
Geographers evaluate the balance between populations and resources using three concepts:
- Carrying Capacity: The maximum population that a region's available natural resources and technology can sustainably support without causing permanent environmental damage.
- Overpopulation: Occurs when a region's population exceeds its carrying capacity, leading to falling living standards, famine, and environmental degradation.
- Optimum Population: The theoretical balance where the population size exploits available resources to achieve the highest possible material standard of living for all citizens.
Two Contrasting Views on Population and Resources
- Thomas Malthus (1798) — The Pessimistic View: Malthus argued that population grows geometrically (1, 2, 4, 8, 16) while food supply increases only arithmetically (1, 2, 3, 4, 5). Eventually, population outstrips food supply, and balance is restored by positive checks (famines, epidemics, and wars that raise the death rate) unless kept in check by preventive checks (later marriage and smaller families that lower the birth rate). Neo-Malthusians argue that desertification in the Sahel supports his core warning.
- Criticisms of Malthus: He failed to anticipate the Agricultural and Industrial Revolutions, artificial fertilisers, refrigeration, mechanisation, and global grain trade, all of which multiplied food production. He also did not foresee that rising living standards and female literacy would naturally reduce fertility rates.
- Ester Boserup (1965) — The Optimistic View: Boserup argued that 'necessity is the mother of invention'. Population growth creates pressure that stimulates agricultural innovation, terracing, irrigation, double-cropping, and mechanisation. The Green Revolution in India, where agricultural yields rose rapidly enough to feed a population expanding from 350 million in 1950 to over a billion, supports her thesis.
Overpopulation in the African Sahel
The Sahel is a semi-arid savannah belt extending south of the Sahara Desert through Mauritania, Mali, Niger, Chad, and Sudan. It supports over 100 million people, but environmental strain has exceeded sustainable thresholds.
- Ten Figures to Learn for the Sahel:
- Population supported: over 100 million people.
- Carrying capacity: very low, because the semi-arid environment has thin soils, unreliable rain, and degraded pasture—it is already exceeded even at densities under 20 people per km².
- National arithmetic densities: under 20 people per km² in Mali and Niger, yet severely overpopulated relative to resources.
- DTM position: Stage 2 (CBR over 40 per 1,000).
- Total Fertility Rate: above 5.0 children per woman in Niger.
- Climate shift: rainy season shortened by roughly 29% since the 1960s.
- Desert advance: Sahara moving southwards by 5 to 10 km annually.
- Lake Chad: shrunk from roughly 25,000 km² in the 1960s to under 2,000 km² (a loss of about 90% of its surface area).
- Displaced people: over 3 million internally displaced in Darfur.
- Remedial initiative: the African Union's 8,000 km Great Green Wall afforestation barrier.
- Demographic and Cultural Pressures: High fertility is sustained by early marriage (frequently before 18), low female literacy, and subsistence dependence on large families for farm labour and old-age security.
- Environmental and Resource Depletion: Sedentary fenced cattle farming has replaced nomadic pastoralism. Overstocking causes severe overgrazing, compacting soil and stripping vegetation. Farmers continuously cultivate cash crops without fallowing (overcropping), and cutting acacia trees for firewood accelerates desertification. Torrential downpours cause gullying, stripping topsoil, and intense heat bakes bare subsoil into an impermeable laterite crust, preventing groundwater recharge.
- Consequences and Solutions: Resource scarcity has driven millions of environmental refugees into shantytowns around cities such as Bamako. Interventions focus on female literacy, stone contour bunds to trap rainwater, farmer-managed tree regeneration, and the Great Green Wall.
Society, Culture, and the Impact of Growth Rates on Development
Cultural values, religion, social customs, and income levels exert powerful influences on population growth and economic development.
Influences on Population Growth
- Religion and Tradition: In Ireland, Catholic social teaching historically influenced laws restricting contraception; the sale of contraceptives remained illegal until the Health (Family Planning) Act 1979 and was only fully liberalised in 1985. Ireland's TFR was roughly 4.0 in the 1960s; it has since declined to around 1.6. In parts of the Sahel and South Asia, traditional customs favour large families to guarantee male heirs and economic support.
- Female Education and Status: Keeping girls in formal education is the single most reliable predictor of falling fertility. Educated women marry later, have access to family planning information, and pursue careers outside the home.
- Income Levels: In subsistence economies, children are economic assets who contribute field labour. In developed economies, children become substantial economic costs due to childcare, education, and housing expenses. Wealthier nations also offer state pensions, removing the necessity of relying on children for elder care.
Contrasting National Population Policies
- Anti-Natalist Policy — China's One-Child Policy (1979–2015): Enacted to curb rapid population growth that threatened economic modernisation. Enforced through financial fines, priority housing and schooling for compliant families, and workplace penalties. While it prevented an estimated 400 million births, it produced severe side effects: an accelerated ageing population, a shrinking labour pool, a skewed birth sex ratio (peaking near 118 boys per 100 girls due to cultural son preference), and the '4-2-1 problem', where an only child must support two parents and four grandparents. China moved to a two-child policy in 2016 and a three-child policy in 2021, yet birth rates have continued to drop.
- Pro-Natalist Policy — France: France encourages larger families using cash child allowances that scale up with each subsequent child, heavily subsidised crèches, tax relief for larger households, and extended paid parental leave, keeping its fertility close to 1.8 births per woman.
How Growth Rates Affect Development
- Rapid Population Growth (Stage 2): High crude birth rates generate a heavy youth dependency ratio (for example, nearly half of Niger's population is under 15). Governments must direct limited tax revenues into basic primary schools, infant vaccinations, and food security rather than revenue-generating infrastructure. Rapid growth also leads to land fragmentation, high youth unemployment, and rapid rural-to-urban flight.
- The Demographic Dividend: When birth rates decline, the existing large youth cohort enters the workforce while the number of child dependants drops. This temporary demographic window provides a high ratio of productive workers to dependants. Ireland benefited from this during the 1990s Celtic Tiger boom, as the large cohorts born in the 1970s joined the labour market alongside rising female participation and foreign direct investment.
- Slow or Negative Growth (Stage 5): Sub-replacement fertility raises the old-age dependency ratio, escalating healthcare and pension costs while contracting the domestic workforce and tax base. Germany and Japan have responded by automating industrial processes and relying on inward migration to staff essential services.
Dynamics and Impacts of Migration: Ireland and Europe
Migration is the permanent or semi-permanent change of residence by an individual or group. It is driven by push factors (negative circumstances pushing people away from home) and pull factors (positive attractions drawing migrants to a destination).
Impacts on Donor and Receiver Regions
- Donor Regions: Emigration functions as an economic safety valve during downturns, reducing unemployment and social welfare claims. Migrants send back financial remittances, which inject money directly into families and local businesses. Globally, remittances exceed US$650 billion annually, outstripping official foreign aid. However, donor regions suffer brain drain—the loss of skilled, educated young professionals educated at public expense (such as Irish doctors emigrating to Australia)—and rural depopulation, which leads to the closure of schools, post offices, and sports clubs.
- Receiver Regions: Inward migration fills domestic labour shortages across agriculture, construction, technology, and healthcare, expanding the tax base and sustaining economic growth. In 2006, migrants filled over two-thirds of new job vacancies in Ireland. However, sudden large population inflows can strain housing markets, hospital capacity, and school enrolments, and may generate social friction if integration policies are inadequate.
Changing Patterns of Irish Migration Since 1950
- 1950s: Economic stagnation and high unemployment sparked heavy net emigration of roughly 408,000 people, mostly young rural workers heading to Britain and the United States. By 1961, the State's population fell to a historic low of 2.82 million.
- 1960s–1970s: Taoiseach Seán Lemass dismantled protectionist tariffs and used IDA grants and export tax reliefs to attract foreign investment. Following Ireland's accession to the European Economic Community (EEC) in 1973, improved economic conditions generated net inward migration as over 104,000 former emigrants returned.
- 1980s: Oil shocks and high national debt pushed domestic unemployment near 17%. Ireland recorded net emigration of over 200,000 people between 1981 and 1991, with peak gross outflows of 70,000 in 1988–1989, causing a serious brain drain of third-level graduates.
- Celtic Tiger (1995–2007): Booming foreign direct investment in technology, finance, and construction transformed Ireland into a major destination for immigrants. Following the 2004 EU enlargement, workers from accession states such as Poland, Lithuania, and Latvia arrived under EU freedom of movement. By 2006, foreign nationals represented over 10% of the population. Asylum applications also peaked at 11,634 in 2002.
- 2008–2014 Recession: The banking and construction crash drove unemployment to 15.1% in 2012, prompting gross emigration of roughly 300,000 people (net emigration was far lower, because immigration continued), with annual outflows peaking at about 89,000 in the year to April 2013 to the UK, Canada, and Australia.
- 2015 to Present: Economic growth restored positive net migration. Net inward migration and natural increase pushed the population in Census 2022 to 5.14 million, the highest figure since 1851.
Migration Policy, Direct Provision, and Cultural Integration
Modern migration policies regulate national borders, work rights, and asylum processing, balancing economic labour requirements against social integration and infrastructure capacity.
Irish Migration Framework
- EU/EEA Freedom of Movement: Citizens of the EU and European Economic Area have the automatic right to live and work in Ireland without work permits.
- Common Travel Area (CTA): Ireland and the United Kingdom have maintained an open-borders travel arrangement since 1922. To preserve the CTA and avoid border infrastructure on the island of Ireland, Ireland opted out of the Schengen Agreement.
- Employment Permits Legislation: Non-EEA workers must secure an employment permit from the Department of Enterprise, Trade and Employment, regulated under employment permits legislation (consolidated in the Employment Permits Act 2024). A General Employment Permit requires an eligible job offer above a set salary threshold and a labour market needs test confirming that no Irish or EEA worker is available. A Critical Skills Employment Permit targets designated shortage occupations (such as software engineering, medical specialists, and engineering), operates with a higher salary threshold, waives the labour market needs test, and offers expedited paths to family reunification and permanent residency.
- Citizenship by Birth: Following the 2004 Citizenship Referendum, the Constitution was amended to remove automatic birthright citizenship (jus soli) for children born in Ireland to non-national parents, requiring proof of legal parental residency.
Direct Provision and International Protection
Asylum applicants who seek refugee status under international law are housed within the Direct Provision system, established in 1999 and administered by the International Protection Accommodation Service (IPAS). Residents receive full-board accommodation, healthcare, and a small weekly personal allowance. Since 2018, asylum seekers who have not received a first-instance decision within six months may apply for permission to work.
- Reforms and Pressures: Direct Provision has faced sustained criticism over extended decision delays, shared communal living, and the psychological impact on children. A 2021 Government White Paper committed to ending Direct Provision in favour of own-door not-for-profit accommodation. However, accommodation pressures intensified after 2022 when Ireland welcomed over 100,000 displaced persons fleeing war under the EU Temporary Protection Directive, a fast-track system distinct from standard asylum processing that immediately grants work and welfare entitlements.
European Union Framework and Integration Challenges
- The Schengen Agreement: Signed in 1985 and implemented from 1995, it abolished internal border controls between participating European nations while establishing common external border checks. Ireland is not a member because it chose to retain the CTA with the UK.
- The Dublin Regulation: Mandates that the first EU member state an asylum applicant enters is responsible for examining their protection claim, using the Eurodac biometric database to prevent 'asylum shopping'. Frontline Mediterranean states (Greece, Italy, Spain) argue this places an unfair administrative burden on them.
- FRONTEX: The European Border and Coast Guard Agency coordinates operations along the EU's external maritime and land frontiers.
- EU Blue Card: Grants residency and work rights to highly qualified non-EU professionals earning between 1.0 and 1.6 times the host nation's average gross salary.
- Integration Approaches: The assimilation model (historically favoured by France) expects immigrants to adopt the secular laws and cultural customs of the host society, exemplified by the 2010 ban on full-face veils in public spaces. In contrast, multicultural models encourage ethnic communities to preserve their cultural and religious identities alongside mainstream institutions. When segregation and unemployment concentrate in suburban housing estates (banlieues), social unrest can occur, as seen during the 2005 French riots.
Rural-to-Urban Migration and Rural Settlement Patterns in Ireland
Settlement analysis explores three spatial elements: Site (the actual physical ground a settlement stands on, such as a gravel terrace, bridging point, or hilltop), Situation (its location relative to surrounding physical features, transport corridors, and other settlements), and Function (its activities, such as defence, trade, administration, or manufacturing).
Chronology of Irish Settlement and Map Clues
| Historical Period | Settlement Characteristics | Irish Examples | OS Map and Aerial Photo Clues |
|---|---|---|---|
| Neolithic (c. 4000–2500 BC) | First permanent farming communities; clearing woodlands; constructing stone field walls and megalithic tombs. | Céide Fields (Mayo), Newgrange (Meath) | Megalithic tomb, dolmen, passage grave, portal tomb. |
| Bronze Age (c. 2500–500 BC) | Introduction of copper and bronze metalwork; ceremonial stone circles; cooking pits on damp soils. | Drombeg (Cork), Lough Gur (Limerick) | Stone circle, standing stone, fulacht fia. |
| Early Christian / Iron Age (c. 500 BC–AD 1100) | Enclosed farmsteads with earthen banks (raths) or drystone walls (cashels); lake dwellings (crannógs); monastic centres. | Clonmacnoise (Offaly), Glendalough (Wicklow) | Ringfort, lios, cashel, round tower, church (cill), high cross. |
| Viking (9th–10th Century) | Fortified maritime havens established at sheltered, navigable river mouths for coastal and overseas trade. | Waterford, Wexford, Limerick, Dublin | Coastal estuaries, narrow quayside streets, '-ford' place names. |
| Anglo-Norman (Late 12th–13th Century) | Walled defensive boroughs built at lowest bridging points of major rivers; stone keeps and earthwork castles. | Kilkenny, Trim (Meath), New Ross (Wexford) | Castle, motte and bailey, town walls, historic bridging point, abbey ruins. |
| Plantation (16th–17th Century) | Planned colonial market settlements laid out on a defensive grid with a central market square known as 'the Diamond'. | Derry, Virginia (Cavan), Portarlington (Laois) | Wide straight streets, central Diamond or square, fortified bawn. |
| 18th–19th Century Estate Towns | Landlord-planned market centres with tree-lined avenues, uniform Georgian architecture, and demesne parklands. | Westport (Mayo), Birr (Offaly), Strokestown (Roscommon) | Demesne, wide street mall, market house, estate gates. |
Worked Map Reading Application: If an OS map shows a castle, town walls, and an abbey beside a river crossing at S 505 561, you should identify it as an Anglo-Norman town. Its site is the lowest bridging point on the river, providing both a river crossing and a defensive position. The castle and town walls confirm its late-twelfth-century defensive origin, and the abbey ruins reflect the religious function that accompanied Norman settlement.
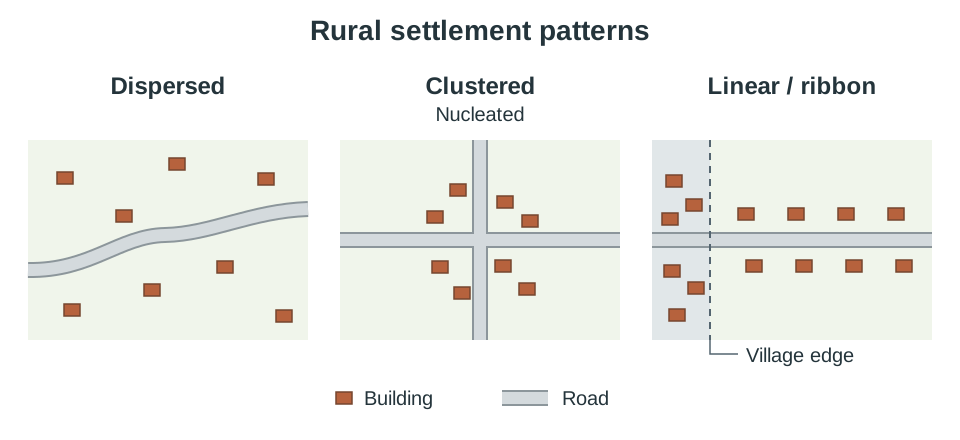
Modern Rural Settlement Distributions
- Dispersed: Individual farmhouses scattered across the countryside. This is the dominant pattern in Ireland today, established after the Land Acts of the late nineteenth and early twentieth centuries broke up landlord estates and granted tenant farmers freehold ownership of their individual holdings.
- Clustered (Nucleated): Houses grouped together at road junctions, around church greens, or in historic open-field hamlets known as clachans. Clachans were linked to the pre-Famine communal rundale system of farming, visible today in the deserted village of Slievemore on Achill Island.
- Linear / Ribbon Development: The construction of houses along main and secondary roads radiating out from urban boundaries. While ribbon development reduces utility installation costs for individual builders, it leads to serious problems: it multiplies private driveways on high-speed roads, increases road safety hazards, risks groundwater pollution from concentrated septic tanks, and inflates the cost of extending piped water, sewerage, and broadband.
Rural Planning Strategies: County Development Plans control rural housing. New houses are normally concentrated inside a village's development boundary, where piped water, sewerage, and footpaths already exist. Outside it, planning permission for one-off houses usually depends on a local-needs test (for example a farmer or someone working locally), on safe sight lines onto the road, and on soil percolation tests for a septic tank. The National Planning Framework's compact growth policy reinforces this by directing most new housing into existing towns and villages rather than open countryside.
Rural-to-Urban Migration: Developed vs Developing Regions
| Feature | Developed Region: Ireland (West to East) | Developing Region: Brazil (Sertão to São Paulo) |
|---|---|---|
| Push Factors | 75% decline in farm employment since 1960 due to mechanisation; lack of off-farm jobs; fewer third-level colleges. | Recurrent drought in the semi-arid Sertão; extreme rural poverty; concentration of farmland in large commercial estates (fazendas). |
| Pull Factors | Jobs in technology, finance, and biopharma; universities and colleges; amenities in Dublin, Cork, and Galway. | Employment prospects in factories and construction; better hospitals; tertiary education in São Paulo. |
| Pace of Growth | Gradual and managed over multiple decades. | Rapid and unmanaged; São Paulo has grown into a megacity of over 22 million people. |
| Urban Housing | Suburban housing estates, commuter towns, and master-planned suburbs (such as Adamstown). | Proliferation of informal squatter settlements (favelas, such as Paraisópolis) on steep hillsides and floodplains. |
| Urban Infrastructure | Traffic congestion (speeds down to 8 km/h on key routes), car dependency, high house prices. | Severe deficits: raw sewage discharged into the Tietê River, contaminated water supplies, deadly landslides, informal street labour. |
| Rural Impacts | Ageing population, high dependency ratios, surplus of unmarried older farmers, closure of post offices and GP clinics. | Loss of working-age adults, family fragmentation, heavy reliance on emigrant remittances for basic food survival. |
| Solutions | National Planning Framework 'compact growth' targets; County Development Plan restrictions; public transport investments. | Self-Help Schemes (providing cinder blocks, roofing, and technical advice) and Site-and-Service Schemes (laying water mains, sewers, and electricity before construction). |
Urban Settlement Dynamics, Hierarchy, and Central Place Theory
Changing Urban Functions Over Time
Urban centres perform a range of functions—defence, administration, commerce, education, and port trade—that change over time:
- Galway: Began as a fortified Anglo-Norman crossing and medieval walled port trading wine and goods with Spain. Today, it has evolved into a global hub for medical technology manufacturing (Medtronic, Boston Scientific), an educational centre (University of Galway, ATU), and a cultural tourism destination.
- Dún Laoghaire: Developed as a major Victorian packet and ferry port connecting to Holyhead. Following the closure of commercial ferry services in 2015, its harbour transitioned toward marine leisure, water sports, and waterfront residential development.
- Cobh: Functioned historically as a deep-water naval base and the primary transatlantic emigration departure port. Today, it operates as a cruise-liner terminal, a heritage tourism centre, and a commuter satellite town for Cork City.
Urban Hierarchy and Primate Cities
A settlement hierarchy ranks settlements by population size and the variety of services they provide, forming a pyramid with numerous small villages at the base and a few large metropolitan cities at the apex. An urban hinterland is the surrounding catchment area served by a settlement.
A primate city is at least twice as large as the second-largest city and dominates the country's economic, political, and cultural life. Dublin city and suburbs had a population of 1.26 million in Census 2022, more than five times the size of Cork city and suburbs (222,000), making Dublin a clear primate city with a nationwide hinterland for high-order services (specialist paediatric hospitals, an international hub airport, and national government).
Walter Christaller's Central Place Theory (1933)
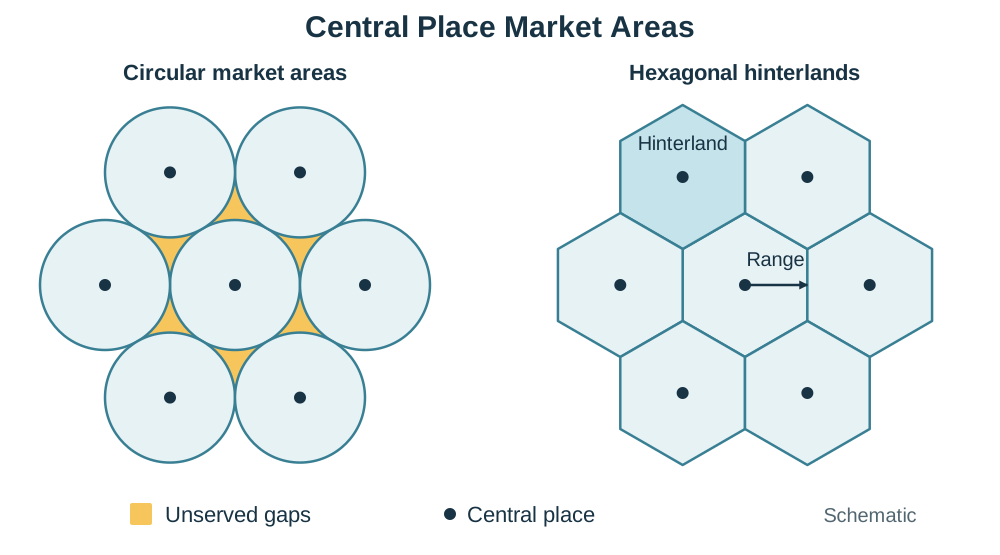
Christaller formulated Central Place Theory to explain the spacing, size, and functional hierarchy of settlements providing services to a surrounding rural population.
- Central Place: A settlement that provides goods and services to its surrounding hinterland.
- Threshold: The minimum population required to generate enough customer demand to make a specific business or service economically viable. A local newsagent needs a threshold of around 500 people; a university or radiotherapy unit requires hundreds of thousands.
- Range: The maximum distance consumers are willing to travel to buy a good or service. Low-order convenience items (bread, milk) have a short range; high-order specialist goods (motor vehicles, specialist surgery, luxury jewellery) have a long range.
- Why Hexagons? Christaller showed that if each central place served a circular market area, the circles would either overlap—creating wasteful competition—or leave unserved gaps between them. Hexagons are the only regular geometric shape that fits together completely without gaps or overlaps while minimising travel distance from the centre to the boundary.
- Assumptions and Limitations: The theory assumes an isotropic surface: an entirely flat, uniform plain with identical transport accessibility, an evenly distributed population, and uniform resources. In the real world, coastlines, mountain ranges, motorways, car ownership, and internet shopping distort this ideal geometry. However, the relatively flat Irish Midlands shows roughly uniform market towns (Athlone, Tullamore, Mullingar) spaced roughly 30 to 40 km apart, reflecting broad central place spacing.
Urban Land-Use Models, Land Values, and Movements
Cities develop internal functional zones shaped by land prices, transport links, and historical expansion patterns.
Classical Urban Land-Use Models
- Burgess Concentric Zone Model (1925): Based on Chicago, this model suggests cities expand outward in five concentric rings: (1) Central Business District (CBD), (2) Transition Zone (older tenements, freight yards, light manufacturing), (3) Low-income working-class housing, (4) Middle-income residential suburbs, and (5) High-income commuter zone. Affluent households trade commuting costs for larger suburban residential plots.
- Hoyt Sector Model (1939): Argues that cities expand outward in wedge-shaped sectors along radial transport corridors (railway lines, canals, arterial roads). Heavy industry and working-class housing align along freight rail lines and river valleys, while high-income residential wedges develop along scenic, elevated, or clean transport routes away from industrial prevailing winds.
- Harris and Ullman Multiple Nuclei Model (1945): Recognises that modern car-oriented cities do not revolve around a single CBD. Instead, distinct functional nodes emerge independently around multiple centres, including suburban retail centres, industrial parks, and airports.
Application to Dublin's Urban Layout
- CBD: High-order retail and finance concentrated around Grafton Street, Henry Street, and College Green.
- Hoyt Industrial / Port Sector: Follows the River Liffey and port facilities eastwards toward Dublin Port, with historic railway and canal manufacturing extending west through Inchicore.
- High-Status Residential Sector: Radiates south-east along Dublin Bay and the DART rail line through Ballsbridge, Blackrock, Dún Laoghaire, and Dalkey.
- Concentric Patterns: Georgian and Victorian housing rings surround the core, encircled by mid-twentieth-century inner suburbs (Crumlin, Cabra) and outer planned suburbs (Tallaght, Clondalkin, Blanchardstown).
Bid-Rent Theory and Social Stratification
Bid-rent theory states that land value is determined by accessibility. Rents peak at the Peak Land Value Intersection (PLVI) within the CBD, where pedestrian footfall and transport convergence are greatest. Only high-revenue commercial businesses (department stores, bank headquarters, corporate law firms) can afford PLVI land prices, forcing developers to build multi-storey structures to maximise usable floor space. Moving outward from the centre, land prices decline sharply, allowing space-extensive land uses (warehousing, detached housing, parks) to operate.
Social stratification describes the segregation of urban residential areas by household income and social class. In Dublin, property values create a clear contrast between affluent southern coastal suburbs and lower-income areas in parts of the north inner city and outer west. Gentrification occurs when higher-income professionals buy and renovate run-down inner-city properties (as in parts of Ringsend, Smithfield, and Stoneybatter), raising property values and local rents, which can displace long-standing working-class residents.
Changing Land Use in an Irish City: Dublin
- Industry Moved Out: Nineteenth-century manufacturing (breweries, distilleries, dockyards) located in the inner city along canals, the river, and rail lines. Over time, congested streets, lack of expansion space, and lorry transport made inner-city sites unviable. Manufacturing relocated to suburban business parks along the M50 motorway: Sandyford, Blanchardstown, and Grange Castle. The land left behind became derelict brownfield sites, later targeted for redevelopment.
- Commerce Decentralised: Retail followed suburban population growth and car ownership out to major M50 motorway junctions: Blanchardstown Centre (1996), Liffey Valley (1998), and Dundrum Town Centre (2005). These developments created secondary peaks in land value outside the CBD and drew retail trade away from traditional city streets. The CBD responded by pedestrianising Grafton Street and Henry Street and focusing on high-order flagship retail.
- Residential Shifts: From the 1960s onward, inner-city slum clearance and car ownership pushed families into new outer suburbs like Tallaght, Clondalkin, and Blanchardstown. Since the 1990s, this flow has partly reversed through re-urbanisation, as tax-incentivised urban renewal schemes and dockland regeneration brought thousands of apartment dwellers back into the city centre.
Four Stages in the Movement of Urban Population
- Urbanisation: An increase in the proportion of a country's population living in urban centres, driven by rural-to-urban migration and natural increase.
- Suburbanisation: The outward spread of population from inner cities to low-density housing on the urban periphery, facilitated by cars, buses, and commuter rail (for example, Dublin's growth in Tallaght and Blanchardstown from the 1960s).
- Counter-Urbanisation: The movement of people beyond the continuous built-up city into commuter towns and rural villages in surrounding counties while continuing to work in the city. Along Ireland's motorway corridors, towns like Naas and Newbridge (M7), Navan (M3), and Drogheda (M1) experienced rapid population growth.
- Re-Urbanisation: The movement of people back into inner-city areas following the redevelopment of brownfield industrial land into modern apartments and offices, as seen in Dublin's Docklands.
Pressures on the Rural-Urban Fringe: Urban sprawl converts high-grade farmland into housing, motorways, and business parks. Speculation raises agricultural land prices, making it difficult for local farmers to expand. One-off housing and septic tanks proliferate, while paving over soil with impermeable concrete and tarmac increases rainwater run-off and downstream flood risks. Small rural settlements are transformed into commuter dormitory towns that lack sufficient local services.
Urban Problems, Solutions, and the Future of Cities (Sub-Unit 5.6)
- Traffic Movement and Congestion: Rapid suburban growth and high car ownership lead to severe traffic gridlock. In Dublin, rush-hour traffic in non-bypassed central corridors has slowed to average speeds of just 8 km/h, causing lost economic productivity and air pollution. Transport management strategies aim to shift commuters onto public transport and divert heavy freight. Key initiatives include the Dublin Port Tunnel (removing heavy goods vehicles from city-centre streets), light rail systems (Luas Green and Red Lines), electrified commuter rail (DART), bus corridors (BusConnects), and park-and-ride facilities at suburban transit nodes.
- Urban Decay, Renewal, and Regeneration:
- Urban Decay and Absence of Community: As industries and affluent residents relocate to suburbs, inner-city areas suffer dereliction, high unemployment, vandalism, and population loss. Large mono-tenure peripheral public housing schemes (such as the 1960s Ballymun high-rise towers) experienced similar physical deterioration and social isolation due to a lack of local shops, recreational amenities, and community infrastructure.
- Renewal vs Regeneration: Urban renewal focuses narrowly on physical rebuilding and demolition (replacing run-down tenements or demolishing the Ballymun flat complexes). Urban regeneration is a broader, holistic strategy that combines physical construction with social support, educational programmes, community facilities, and economic employment schemes. In Dublin's Docklands, the Dublin Docklands Development Authority (DDDA) redeveloped disused brownfield port land into modern financial and tech offices (the 'Silicon Docks') alongside social housing quotas, new schools, and community recreation centres.
- Heritage Conservation vs Redevelopment: Modern city expansion often threatens historic architecture and archaeological remains. Local authorities manage conservation through the Record of Protected Structures (RPS), which protects architecturally significant buildings from demolition, and Architectural Conservation Areas (ACAs), which preserve the historic character of entire streetscapes (such as Georgian Dublin).
- Conservation Success: Temple Bar, Dublin (and Waterford's Viking Triangle). Instead of being demolished for a proposed central bus terminus in the 1980s, Temple Bar's medieval street pattern and historic buildings were preserved and renovated into a bustling cultural, arts, and tourism quarter.
- Conservation Failure: Wood Quay, Dublin. In the late 1970s and 1980s, Dublin Corporation constructed civic office bunker blocks directly on top of an internationally significant Viking settlement and waterfront wharf, destroying irreplaceable archaeological layers despite nationwide street protests and court challenges.
- Environmental Quality: Rapid urbanisation degrades air, water, and acoustic environments. High coal consumption historically produced winter smog and respiratory illness in Dublin. The landmark 1990 Dublin Smoky Coal Ban prohibited the marketing, sale, and distribution of bituminous coal, cutting winter particulate smoke by 70% and preventing thousands of premature respiratory and cardiovascular deaths—a model subsequently extended across Europe. Modern environmental management also targets water quality through advanced wastewater treatment (such as Ringsend Wastewater Treatment Plant) to reduce sewage pollution in Dublin Bay.
- Developing-World Urban Expansion: In megacities across the developing world (such as São Paulo, Mumbai, and Nairobi), rural-urban migration outpaces municipal funding. Migrants establish informal settlements (favelas or shantytowns) on hazardous, unzoned marginal land—steep hillsides prone to lethal mudslides or poorly drained floodplains. Dwellings lack basic civic infrastructure: piped clean water, mains sewerage, waste collection, and electricity. Residents face insecure land tenure, waterborne disease outbreaks, and exploitation by criminal gangs. Solutions rely on Self-Help Schemes (providing materials like breezeblocks, timber, and roofing sheets for residents to upgrade their homes) and Site-and-Service Schemes (where the city installs basic roads, water mains, and electricity grids before plots are allocated).
- The Future of Urbanism and Sustainable Planning: Future cities must accommodate growing populations without expanding endlessly into countryside. Ireland's National Planning Framework (Project Ireland 2040) targets compact growth, requiring that at least 40% of all new homes nationwide be delivered within existing built-up urban footprints, prioritising brownfield regeneration over greenfield sprawl. Sustainable cities of the future (such as Freiburg in Germany, renowned for solar housing, car-free suburban districts, and extensive tram networks) integrate district heating, cycling corridors, 15-minute neighbourhood design (where daily work, school, and leisure needs are reachable within a 15-minute walk or cycle), and dense public transport networks.
Key terms
- Carrying Capacity
- The maximum population that a region's available natural resources and technology can sustainably support without permanent environmental degradation.
- Physiological Density
- The total number of people divided by the area of arable, agriculturally productive land.
- Dependency Ratio
- A mathematical ratio comparing the combined non-working population (ages 0–14 and 65+) against the working-age population (ages 15–64).
- Total Fertility Rate (TFR)
- The average number of children born to a woman during her childbearing years, with 2.1 representing replacement-level fertility.
- Brain Drain
- The large-scale emigration of educated, skilled professionals from their home region, depriving the donor economy of human capital.
- Remittance
- Money earned by an emigrant worker sent back home to support family members living in the donor region.
- Direct Provision
- The Irish state accommodation and welfare system established in 1999 to house asylum seekers while their international protection applications are processed.
- Ribbon Development
- The linear construction of houses along rural roadways extending outward from urban boundaries.
- Central Place
- An urban settlement that provides goods and services to the population of its surrounding hinterland.
- Threshold
- In Central Place Theory, the minimum population required to generate enough customer demand to make a service economically viable.
- Range
- In Central Place Theory, the maximum distance consumers are willing to travel to purchase a specific good or service.
- Primate City
- A city that is disproportionately large—at least twice the size of the second city—and dominates the economic, political, and cultural life of a nation.
- Peak Land Value Intersection (PLVI)
- The single location within the Central Business District where accessibility and footfall converge, commanding the highest commercial rent per square metre.
- Bid-Rent Theory
- An economic theory explaining that land uses bid for urban plots based on accessibility, with commercial functions outbidding residential and industrial uses at the core.
- Urban Sprawl
- The rapid, unplanned, low-density horizontal expansion of a city into surrounding agricultural land.
- Counter-Urbanisation
- The movement of people out of cities and large suburbs into commuter towns and rural villages located well beyond the urban edge.
- Gentrification
- The process of renovating deteriorated inner-city housing by higher-income buyers, which increases property values and often displaces lower-income residents.
- Favela
- An informal, unplanned squatter settlement located on hillsides or marginal land in Brazilian cities, typically lacking legal tenure and public services.
- Site-and-Service Scheme
- A municipal development strategy in developing cities where public authorities supply partitioned land plots with basic water, power, and sewage connections before families build their own dwellings.
- Urban Regeneration
- A comprehensive strategy to upgrade declining urban areas by addressing physical, social, and economic deprivation at the same time.
Check yourself
What is the key difference between arithmetic population density and physiological population density?
Arithmetic density divides total population by total land area, whereas physiological density divides total population strictly by the area of arable (farmable) land, reflecting real pressure on food-producing capacity.
A country records a CBR of 38 per 1,000 and a CDR of 12 per 1,000. Calculate its natural increase as a percentage.
Natural increase per 1,000 is 38 - 12 = 26 per 1,000. Expressed as a percentage: (26 / 10) = 2.6%.
Why did Walter Christaller choose hexagons instead of circles to represent central place market hinterlands?
Circular market areas either overlap (creating wasteful market competition) or leave unserved gaps between settlements. Hexagons fit together completely without gaps or overlaps while minimising travel distance.
According to Bid-Rent Theory, which land use outbids all others at the Peak Land Value Intersection (PLVI)?
High-order commercial, financial, and retail uses, because they require maximum accessibility and footfall to generate high profits per square metre, enabling them to pay peak rents.
Give two reasons why manufacturing industry moved out of Dublin's inner city to suburban motorways.
Inner-city sites were small, congested, and expensive to expand, whereas modern manufacturing requires large single-storey premises, extensive lorry parking, and rapid motorway access via routes like the M50.
Distinguish between suburbanisation and counter-urbanisation, giving an Irish example of each.
Suburbanisation is the outward growth of housing on the city edge (e.g. Tallaght in Dublin). Counter-urbanisation is the movement of commuters beyond the city entirely into separate rural towns in neighbouring counties (e.g. Navan in Meath or Naas in Kildare).
What does the National Planning Framework's 'compact growth' target require?
It requires that at least 40% of all new housing nationwide be built within the existing built-up footprints of cities, towns, and villages to curb urban sprawl.
Name one Irish example of urban heritage conservation succeeding and one where redevelopment defeated conservation.
Success: Temple Bar's restoration as a cultural quarter (or Waterford's Viking Triangle). Failure: Wood Quay, Dublin, where office blocks were built over a significant Viking settlement despite major public protests.