

Statistics is about collecting, organising, analysing, and interpreting data to answer questions about populations. The exam asks you to classify data, draw and read graphs and stem-and-leaf plots, work out the mean, median, mode and range, estimate the mean of a grouped table, and comment on bias and limitations.
Data Collection, Classification, and Frequency Tables
A statistical question anticipates variability in answers and specifies a population, unlike a question with a single fixed answer.
- The population is the entire group studied; a sample is a subset chosen to represent it.
- Avoid bias by choosing a representative sample, asking neutral questions, and sampling randomly across groups.
- Categorical data consists of descriptive labels; numerical data consists of numbers, either discrete (counted) or continuous (measured).
- A frequency table lists each value or class interval alongside how often it occurs.
- Use a tally to count frequency; is the total number of data values.
- Grouped frequency tables use class intervals (such as ) for continuous data.
Graphical Displays and Back-to-Back Stem-and-Leaf Plots
Different graph types suit different variables:
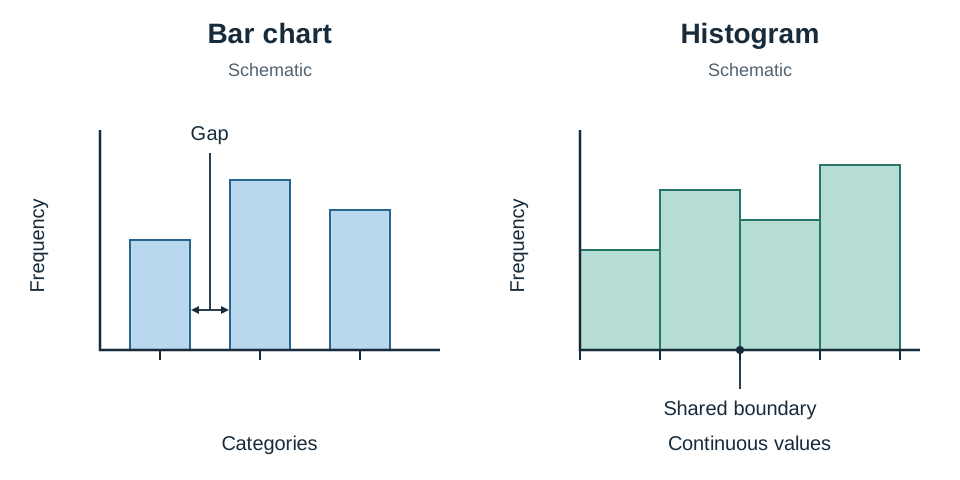
- Bar charts: Show categorical or discrete data using equal-width bars separated by gaps.
- Histograms: Display continuous grouped data using equal intervals where neighbouring bars touch without gaps.
- Pie charts: Represent proportions of , where .
- Line plots: Stack dots or crosses above a number line to show frequencies in small datasets.
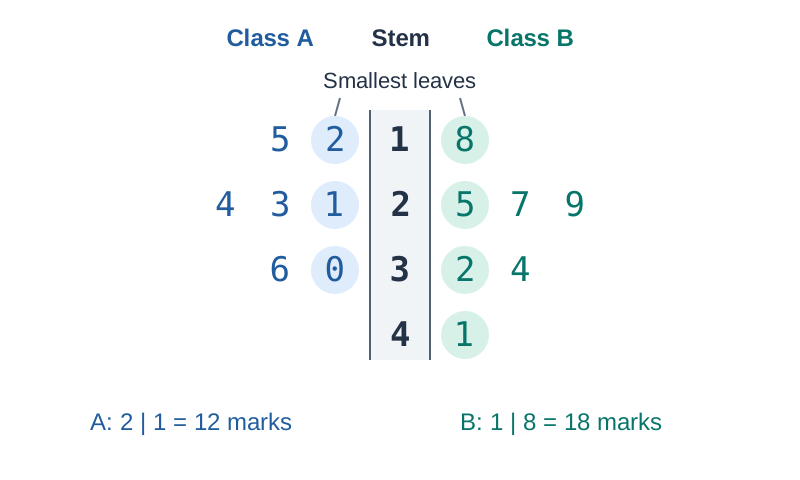
An ordered back-to-back stem-and-leaf plot compares two distributions using a shared central column of stems:
- Leaves on the right read normally from left to right, smallest closest to the stem.
- Leaves on the left read backwards: smallest digit closest to stem, largest furthest left.
- Write each leaf as a single digit, spaced evenly without commas.
- Always include a key showing how to read both sides, including units.
Measures of Centre, Spread, and Grouped Means
- Mode: The most frequent value. For grouped data, the modal class has the highest frequency.
- Median: The middle value of ordered data, or the average of the two middle values.
- Mean: Add the values and divide by their count, : , so .
- Range: The spread of values: .
- Estimated mean: Use mid-interval values when exact grouped values are unknown:
where is frequency and is the midpoint.
Outliers, Misleading Graphs, and Evaluating Investigations
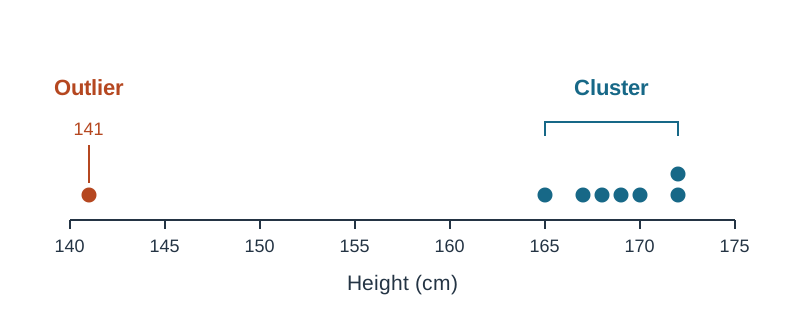
- An outlier lies far from other values; it can pull the mean towards it and increase the range.
- The median is less affected by extreme outliers than the mean.
- To identify an outlier, state the value and explain that it lies far from the cluster.
- A bar chart whose vertical axis starts above zero can exaggerate differences. Check the scale.
- A representative sample can suggest patterns in the population, but conclusions remain uncertain.
Key terms
- Statistical Question
- A question that anticipates answers that vary and specifies a population and measurement of interest.
- Population
- The entire group of people or items being studied in an investigation.
- Sample
- A smaller group selected from a population to represent the whole.
- Frequency Table
- A table that lists values or class intervals alongside the count of how often each occurs.
- Mid-Interval Value
- The exact midpoint of a class interval, calculated as (lower limit + upper limit) / 2.
- Range
- The difference between the highest value and the lowest value in a dataset.
- Outlier
- A data point located far away from the rest of the values, which can distort the mean and range.
- Confounding Variable
- An unmeasured factor that may influence the results of a study and distort conclusions.
Check yourself
A class interval in a table is 20–30. What value do you use for it when estimating the mean?
25, the mid-interval value, found by (20 + 30) / 2.
All other students measure between 165 cm and 172 cm; one student measures 141 cm. How do you justify calling 141 cm an outlier?
State that 141 cm is an outlier because it is far below the rest of the data, which is clustered between 165 cm and 172 cm.
Why is the median often preferred over the mean for data with extreme outliers?
The median uses the middle value or values, so extreme values usually affect it less than the mean.
Four test results have a mean of 15. When a fifth test is added, the mean becomes 16. What was the fifth score?
20, calculated as (5 16) - (4 15) = 80 - 60 = 20.