

Probability is a measure on a scale of 0 to 1 of how likely an event is to occur. In the Junior Cycle examination, you will calculate theoretical probabilities, systematically list outcomes using tables and tree diagrams, apply counting principles, and evaluate experimental data.
The Probability Scale and Single Events
Probability measures the likelihood of an event on a scale from to , written as a fraction, decimal, or percentage.
| Value | Likelihood | Example |
|---|---|---|
| Impossible | Rolling a on a standard six-sided die | |
| Even chance | Tossing heads on a fair coin | |
| Certain | Rolling a number less than on a standard die |
When all individual outcomes are equally likely, calculate probability using the rule:
- The probabilities of all the possible outcomes always add up to .
- The complement rule gives the probability of an event not happening: .
- If in its simplest form and each item is equally likely to be chosen, the total number of items must be a multiple of . This explains why a box cannot hold exactly 20 pens when .
Systematic Sample Spaces: Trees and Tables
A sample space is the complete set of all possible outcomes of an experiment. Outcomes must be listed systematically so none are missed.
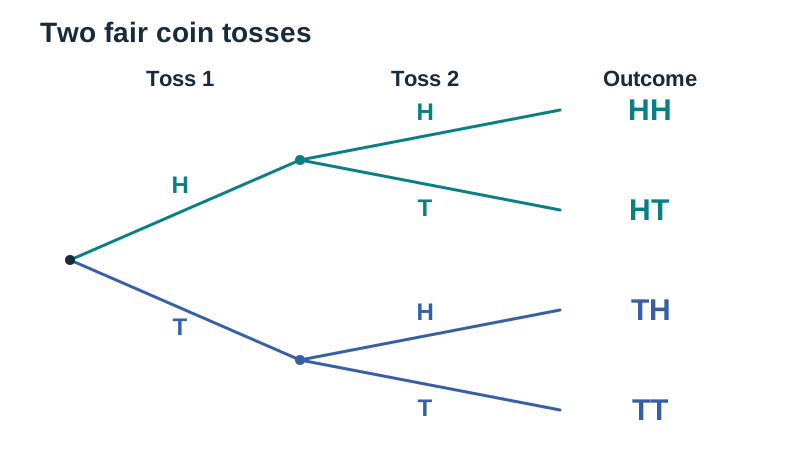
A tree diagram displays successive events in stages. For two fair coin tosses:
- Toss 1 branches into H or T.
- Under H, Toss 2 branches into H (giving outcome HH) and T (giving HT).
- Under T, Toss 2 branches into H (giving outcome TH) and T (giving TT).
Four branch ends give four outcomes: HH, HT, TH, TT. Label every branch with its outcome and follow the path from left to right.
A two-way table organises the sample space for two independent events into rows and columns.
- Order matters in successive trials: and are distinct outcomes.
- When all cells in the grid are equally likely, probability is found by dividing the number of matching cells by the total number of cells.
Counting Principles and Combined Events
The fundamental principle of counting states that if each of first choices allows second choices, there are combinations. For example, 3 brands, 4 colours, and 4 sizes give choices.
- For repeated trials with the same number of options, use powers: rolling a die twice gives outcomes.
- Independent events do not affect each other's probabilities. For these events, multiply: .
- Mutually exclusive events cannot both occur in the same trial. For these events, add: .
- For "at least one" questions over repeated trials, find the probability of none happening and subtract from 1: . For two independent games, each with , , giving .
Relative Frequency and Experimental Probability
When you cannot work out the theoretical probability, data from an experiment gives you an estimate of it.
- Relative frequency is an experimental estimate of theoretical probability.
- More trials generally give a better estimate, although each extra trial need not improve it.
Key terms
- Probability
- A measure on a scale of 0 to 1 of how likely an event is to occur.
- Sample Space
- The set of all possible outcomes of an experiment.
- Event
- A specific outcome or collection of outcomes of interest.
- Independent Events
- Events where the occurrence of one does not affect the probability of the other occurring.
- Mutually Exclusive Events
- Events that cannot happen at the same time in a single trial.
- Fundamental Principle of Counting
- A rule stating that if each of m first choices allows n second choices, there are m x n combinations.
- Relative Frequency
- The number of times an event occurs divided by the total number of experimental trials.
Check yourself
What is the probability of an impossible event?
0
If P(red) = 3/8, what is P(not red)?
1 - 3/8 = 5/8
Two fair coins are tossed independently. What is P(exactly one head)?
The outcomes are HH, HT, TH, TT; matching outcomes are HT and TH, so 2/4 = 1/2.
A drawing pin lands point-up 28 times in 80 drops. What is the relative frequency?
28/80 = 7/20 = 0.35
A bag contains only red and blue marbles, and each marble is equally likely to be selected. If P(red) = 2/7, explain why there cannot be 25 marbles in total.
The total number of marbles must be a multiple of 7 for 2/7 of the total to be a whole number, and 25 is not divisible by 7.