

Working with graphs connects algebraic formulas, numerical patterns, and coordinate geometry to visual lines and curves. The Junior Cycle exam tests plotting functions, finding line equations, interpreting rates of change, and reading roots and inequalities directly from graphs.
Functions, Patterns, and Rules
A function gives each permitted input from its domain exactly one output in its codomain; the range contains the outputs actually reached. The notations and describe the same rule. For equally spaced inputs:
- Linear: constant first differences.
- Quadratic: constant non-zero second differences. For pattern terms at positions , the second difference is . Half the second difference is , the coefficient of . Subtracting leaves , giving .
- Exponential: outputs multiply by a fixed ratio each step (such as doubling or tripling).
Plotting Functions and Domain Rules
Make a table of values by substituting each domain value into the function rule. Always use brackets when squaring negative inputs: .
| Function Type | Equation Form | Defining Shape |
|---|---|---|
| Linear | Straight line (use a ruler) | |
| Quadratic | Parabola: U-shape if , inverted U if | |
| Exponential | or | Smooth rising curve through |
| Cubic | Smooth curve that can turn twice (draw freehand) |
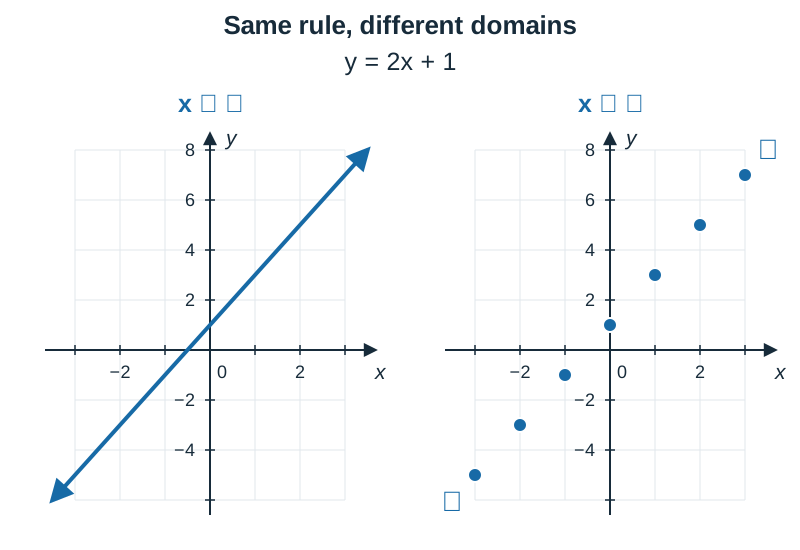
If , connect the points with a continuous line or smooth curve. If or , plot each point as a separate dot and leave them unconnected.
Coordinate Geometry of the Line
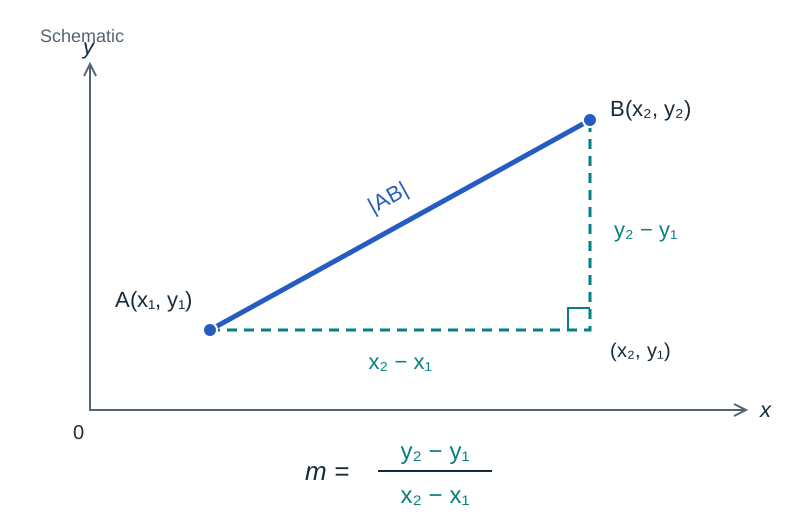
For points and :
- Distance: .
- Midpoint: .
- Slope: . Horizontal lines have slope ; vertical lines have undefined slope.
- Parallel and perpendicular: non-vertical parallel lines have equal slopes; vertical lines are parallel. Perpendicular lines with defined slopes satisfy . Horizontal and vertical lines are perpendicular.
- Line equation: use . A line with slope through gives , simplifying to .
- Rearranging: to find the slope and y-intercept of , isolate . For , , giving , with slope and intercept .
Reading Answers and Interpreting Graphs
For a straight segment, rate of change is vertical change divided by horizontal change. With distance travelled vertically and time horizontally, slope gives speed; a horizontal segment means stationary.
| Exam Instruction | Action on Drawn Graph |
|---|---|
| Evaluate | Go to on the horizontal axis and read the corresponding -value. |
| Find roots or solve | Read the -values where the curve meets or touches the -axis. |
| Solve | Draw a horizontal line at and read the intersection -values. |
| Maximum or minimum | Find the highest or lowest point on the given domain. The -value is the value; the -value is when it occurs. |
State -values only when solving equations in .
Intersections and Inequalities
When comparing two functions and :
- Solve : read the -values of the intersection points.
- Point of intersection: state the full coordinate pair . This solves simultaneous equations graphically.
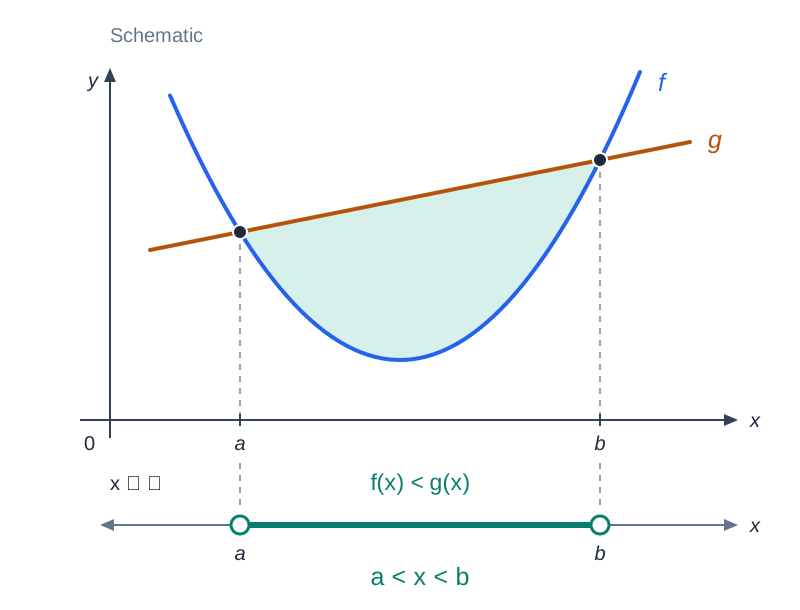
- Solve : find all -values where the graph of lies below the graph of . Give all permitted -values, using one or more intervals or separate values as appropriate; strict inequalities exclude equality points.
- Number lines: for linear inequalities like , simplify to . Draw a solid dot for or and an open circle for or . Shade a solid line with an arrow for , but mark isolated dots for or .
Key terms
- Domain
- The set of all permitted input values (-values) for a function.
- Range
- The set of actual output values (-values) generated by a function. Codomain: the stated target set containing all outputs.
- Parabola
- The symmetrical U-shaped or inverted U-shaped curve created by a quadratic function.
- Turning point
- The vertex where a curve changes from increasing to decreasing (maximum) or decreasing to increasing (minimum).
- Root
- An input value for which , found where the graph meets the -axis.
- Rate of change
- The change in the vertical quantity divided by the change in the horizontal quantity, represented by the slope of a line segment.
- y-intercept
- The coordinate point where a line or curve crosses the vertical axis.
Check yourself
A straight line passes through (0, 40) and (4, 100), where y is the charge in euro and x is hours worked. What is its slope, and what does it mean in context?
Slope = (100 - 40) / 4 = 15; it means the charge increases by €15 per hour.
What is the midpoint of the line segment joining A(-1, 3) and B(5, 7)?
(( -1 + 5 ) / 2, ( 3 + 7 ) / 2) = (2, 5).
How do you represent the solution to x < 4 on a number line for x in R?
Draw an open circle at 4 and shade a solid line to the left with an arrow.
Where does the graph of y = 2x - 8 intersect the x-axis?
At (4, 0), found by setting y = 0 and solving 2x - 8 = 0.