

A function is a mathematical rule that assigns each input from a domain to exactly one output. In the Junior Cycle Higher Level exam, you will identify patterns from tables, plot linear, quadratic, cubic, and exponential graphs, and use these graphs to solve equations, inequalities, and real-world problems.
Function Concepts, Notation, and Rules
A function takes an input and applies a rule to produce exactly one output or . The vertical line test shows that a curve is a function if every vertical line crosses it at most once.
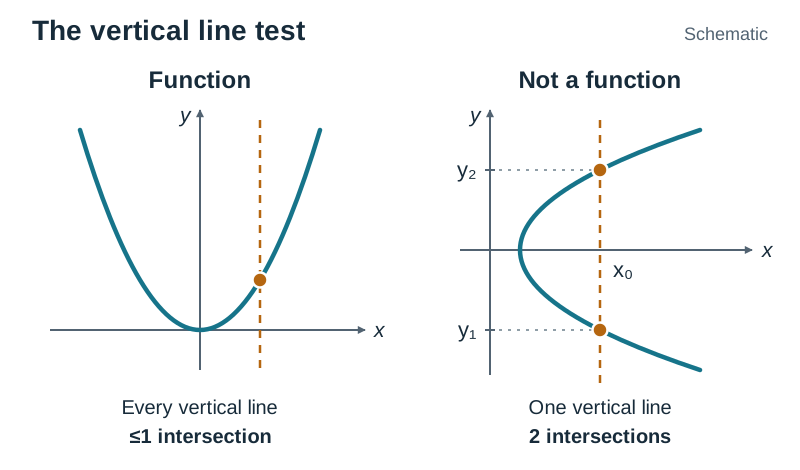
- The domain is the set of allowed inputs.
- The co-domain is the target set that outputs can come from.
- The range is the set of actual outputs produced by the domain.
For example, if the domain is and the rule is , the outputs are and , giving the range .
These notations describe the same rule:
For inputs 0, 1, 2, 3, outputs 1, 4, 9, 16 give . A €5 fixed charge plus €2 per unit gives .
Spotting Patterns in Tables and Graph Shapes
When inputs go up in steps of 1, check the pattern in the outputs:
- First differences equal linear.
- Constant, non-zero second differences quadratic.
- Outputs double or triple for each input step exponential.
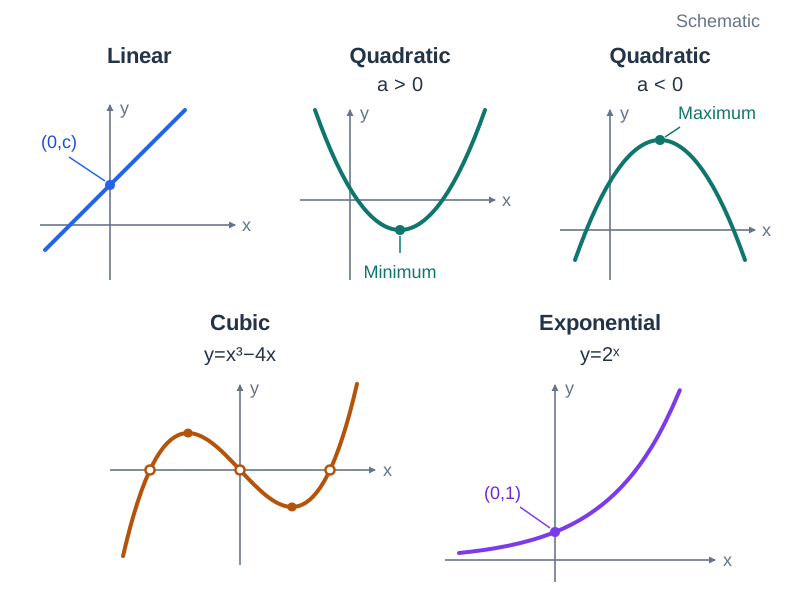
| Function Type | Form | Graph Shape | Key Features |
|---|---|---|---|
| Linear | Straight line | Constant slope ; -intercept at . | |
| Quadratic () | U-shaped curve | Symmetrical parabola; lowest point is a minimum turning point. | |
| Quadratic () | -shaped curve | Inverted parabola; highest point is a maximum turning point. | |
| Cubic | S-shaped curve | Can turn twice; plot from a table of values. | |
| Exponential | or | Rising curve | Doubles or triples for each step of 1 in ; passes through and stays above the -axis. |
Plotting Functions and Domain Rules
Always check the number set specified for the domain before graphing:
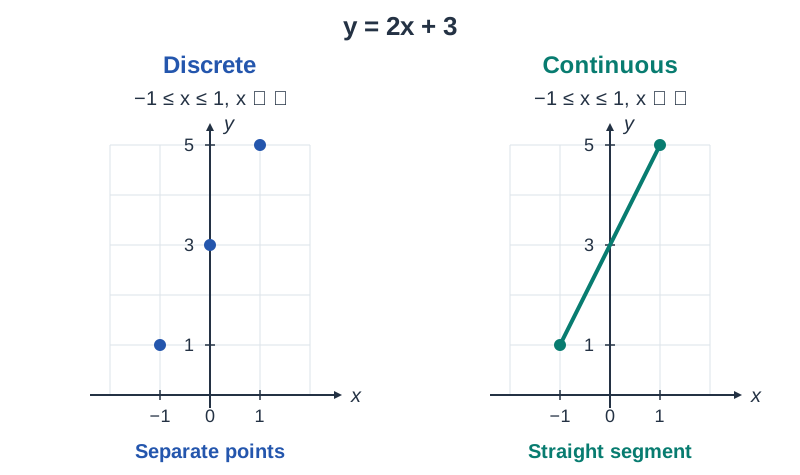
- Discrete domains ( or ): Plot separate dots only. Never join them, because non-integer inputs are not permitted.
- Continuous domains (): Plot the points and join them. Use a straight edge for linear functions, or draw a smooth curve for quadratics, cubics, and exponentials.
- Curve smoothly through the lowest or highest point; never draw it flat or make it a sharp corner.
- Stay inside the domain given in the question; never extend your graph beyond its stated boundaries.
Solving Graphically and Interpreting Real-World Graphs
Graphs provide visual estimates to equations and inequalities:
- A root is where , seen as an -intercept.
- To solve , read the -coordinates where the horizontal line meets the curve.
- To solve , read the -coordinates where both graphs meet or touch.
- To solve , find the -values where the graph of sits strictly below .
On real-world graphs, the -intercept is the starting value, and the slope is the rate of change. On a distance–time graph, . A steeper slope means a faster speed, while a horizontal line means stopped. Show graphical readings clearly; dotted guide lines can help. Read to the graph's scale and the accuracy requested, and state your answer with units.
Key terms
- Function
- A mathematical relationship where each input produces exactly one output.
- Domain
- The complete set of allowed input values for a function.
- Co-domain
- The stated target set containing all the function's potential outputs.
- Range
- The set of actual outputs produced when every domain value is put into the function.
- Vertical Line Test
- A visual test where a graph represents a function if no vertical line intersects it more than once.
- Root
- An input value where , corresponding to an -intercept on a graph.
- Turning Point
- A point where a curve changes from increasing to decreasing, or from decreasing to increasing.
Check yourself
Can an input map to two outputs and in a function?
No, because a function must assign each input to exactly one output.
The values 2, 6, 12, 20 have first differences 4, 6, 8. What type of pattern is this?
Quadratic, because the second differences are all constant at 2.
For with domain , what is the range?
, because elements in a set are listed only once.
A harbour's water height in cm has a minimum at , where is hours after noon. Interpret this point.
The lowest water height is , reached after noon.