
Statistics - Z Scores

Leaving Cert Higher Level Mathematics revision notes with diagrams.

3 min readHigher LevelBy Studytok
Practise this topic — free →

Normal Distribution

The normal curve is symmetric and bell-shaped. We convert values to a z-score to use the tables: z = (x − μ) / σ, where μ is the mean and σ is the standard deviation. A z-score tells you how many standard deviations a value is from the mean. The Formulae and Tables booklet gives P(Z ≤ z) for positive z. Use: P(Z > z) = 1 − P(Z ≤ z); P(Z ≤ −z) = 1 − P(Z ≤ z); and P(a ≤ Z ≤ b) = P(Z ≤ b) − P(Z ≤ a). For 'top 25%' questions, look up 0.75 in the body of the tables to find z, then solve x = μ + zσ.
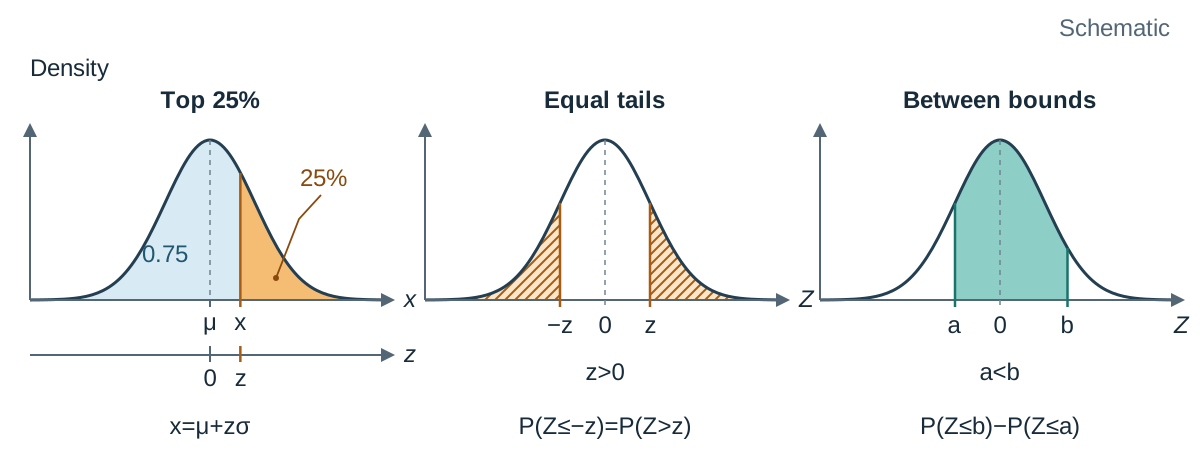
Three schematic normal curves show a top-quarter cutoff, equal opposite tails, and an interval between two bounds.
You've read the theory
Now turn it into exam marks.

Practise statistics - z scores as questions and flashcards in Studytok, with explanations when you get stuck.

Continue for free →
  1. ✓
    Read the notes
    1 sections
  2. 2
    Test yourself
    Questions marked instantly
  3. 3
    Keep revising
    Flashcards and exam-style practice