

A thermal equilibrium diagram, also called a phase diagram, maps the phases present in an alloy system across varying temperatures and compositions under slow heating or cooling conditions. For Leaving Certificate Higher Level Engineering, students must understand how experimental cooling curves generate these diagrams, how crystals solidify via dendritic growth, how to read binary solid-solution and simple eutectic systems using the lever rule, and how to apply the iron-carbon diagram to control microstructures during heat treatments such as annealing, normalising, and hardening.
Cooling Curves and Diagram Construction
A thermal equilibrium diagram is a graph of temperature plotted against composition. It tells you which phases are present in an alloy at any temperature, provided the alloy is heated or cooled slowly enough for the atoms to reach their settled positions.
A phase is a physically distinct, chemically uniform part of a metal or alloy that has its own crystal structure—for example, liquid melt, crystals of pure metal, or a solid solution. Metallurgists construct equilibrium diagrams experimentally by recording cooling curves for a series of known compositions across an alloy system.
To record a cooling curve, an alloy sample is melted in a crucible, and a thermocouple connected to a pyrometer or data logger records its temperature at regular time intervals as it cools to room temperature.
Sketching and Interpreting Cooling Curves
When sketching cooling curves, always place temperature in °C on the vertical axis and time in minutes or seconds on the horizontal axis.
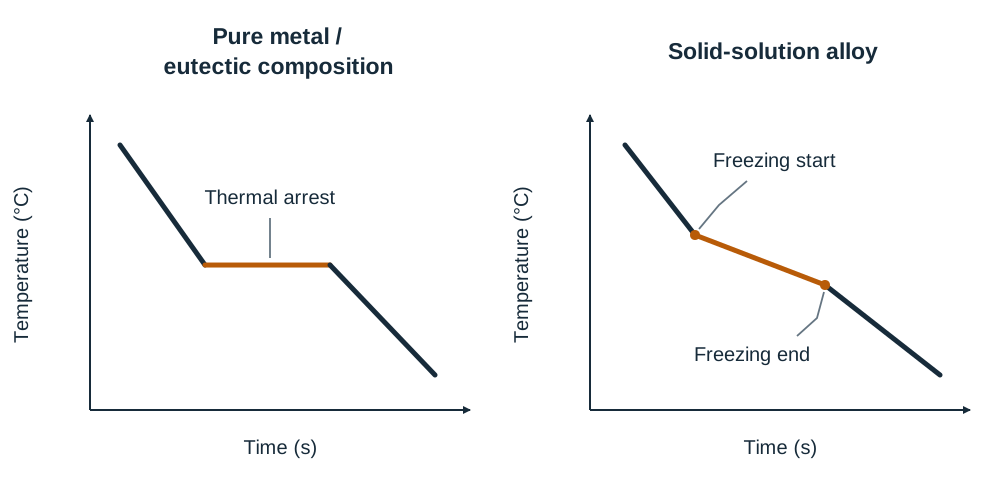
- Pure metals: Solidify at a single, constant temperature. The curve falls smoothly until freezing starts, where it halts into a horizontal flat line known as a thermal arrest. Solidification releases the latent heat of fusion, which balances natural heat loss until the entire sample has turned solid, after which cooling resumes.
- Solid-solution alloys: Solidify over a temperature range. The curve shows a distinct change of slope where freezing begins at the liquidus line, and a second change of slope where freezing ends at the solidus line. Between these temperatures, latent heat is released gradually as dendrites grow within the remaining liquid.
- Eutectic composition alloys: Although mixtures of two metals, they solidify at a single constant temperature without an intermediate range, displaying a sharp horizontal thermal arrest identical in shape to a pure metal.
Building a Binary Diagram from Cooling-Curve Data
- Prepare a series of alloy samples across the composition spectrum in regular mass increments (for example, 0%, 20%, 40%, 60%, 80%, and 100% of Metal B).
- Heat each composition into a uniform liquid and record its temperature over time as it cools slowly.
- Identify the temperature where solidification begins (the upper slope change or arrest) and where solidification finishes (the lower slope change or arrest) for each composition.
- Set up graph axes with temperature in °C on the vertical axis and percentage composition by mass on the horizontal axis.
- Plot the start-of-freezing temperatures and connect them with a smooth line to form the liquidus line.
- Plot the end-of-freezing temperatures and connect them with a smooth line to form the solidus line.
Above the liquidus line, the alloy is entirely liquid. Below the solidus line, the alloy is entirely solid. The region between the liquidus and solidus lines is the pasty region, where solid crystal dendrites and molten alloy coexist.
Solidification and Dendritic Crystal Growth
As molten metal cools below the liquidus temperature, solidification begins at microscopic solid particles or chilled mould surfaces known as nucleation centres.
Crystals do not expand outwards as smooth spheres. Heat conducts away preferentially along specific crystallographic directions, causing crystals to sprout rapid, tree-like branches called dendrites (from the Greek word for tree).
The Solidification Sequence
- Tiny solid nuclei form at nucleation centres throughout the cooling melt.
- Solidification accelerates along primary axes, shooting out main dendritic stems.
- Secondary and tertiary arms branch off the main trunk at right angles, creating a three-dimensional framework resembling pine branches or ferns.
- Liquid metal trapped between the branching arms freezes as the temperature continues to fall.
- Neighbouring dendrites keep growing until their outer branches meet and lock together. The resulting interlocking crystal networks form individual crystal grains, and the collision interfaces become the grain boundaries of the finished solid metal.
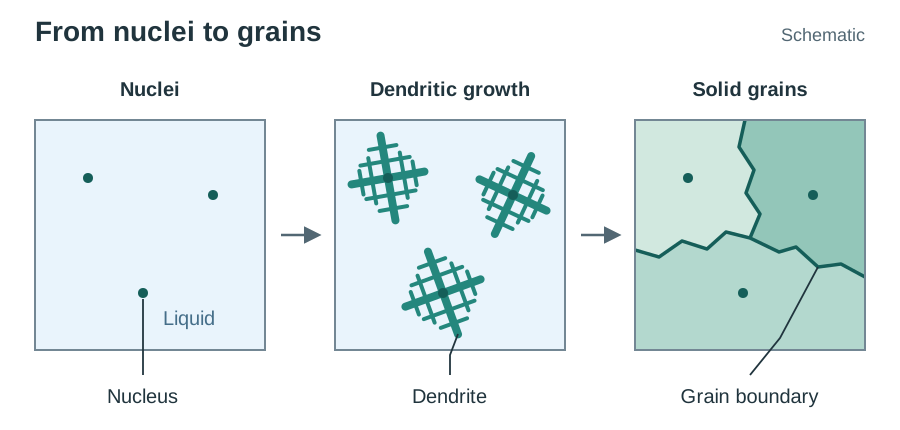
The pasty region on an equilibrium diagram is the temperature range in which these dendrites exist surrounded by liquid. The wider that range, the longer the metal stays pasty during casting.
How Metals Combine: Solid Solutions, Eutectics, and Compounds
Metals combine in three principal ways to form binary alloys:
1. Solid Solutions
Both metals dissolve completely in each other in both the liquid and solid states. The atoms share a single, uniform crystal lattice.
- Substitutional solid solutions: Solute atoms replace solvent atoms directly on lattice sites (for example, copper and nickel). This requires atoms of similar size and crystal structure.
- Interstitial solid solutions: Very small solute atoms fit into the spaces (interstices) between larger parent metal atoms, such as carbon dissolving into iron.
A complete solid-solution equilibrium diagram forms a smooth lens-like envelope containing three regions: liquid () above the liquidus, pasty solid solution plus liquid () between liquidus and solidus, and single-phase solid solution () below the solidus.
2. Simple Eutectic Systems
The two metals dissolve completely when molten, but are virtually insoluble in each other in the solid state (such as lead-tin or cadmium-bismuth mixtures).
On the diagram, two liquidus lines slope downward from the pure-metal melting points, meeting at a low point called the eutectic point. A single horizontal solidus line runs through that point across the whole diagram, representing the eutectic temperature.
- Four main fields appear: Liquid () on top, Solid A + Liquid on the left, Solid B + Liquid on the right, and Solid A + eutectic / Solid B + eutectic below the horizontal solidus line.
- At the eutectic point, liquid freezes directly at a single constant temperature into an intimate mechanical mixture of two solid phases without any pasty range: .
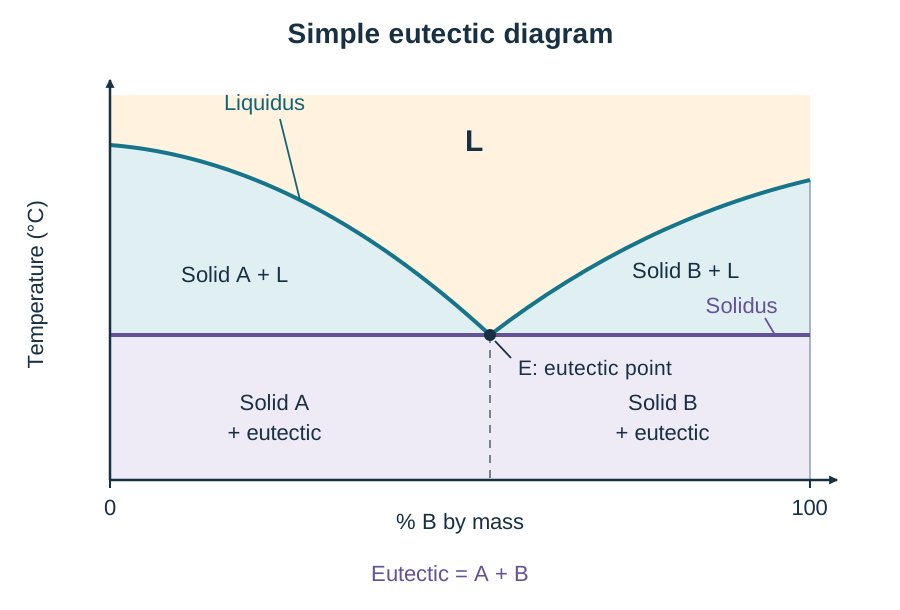
Significance in Practice: The eutectic composition has the lowest melting point in the alloy system and freezes sharply without an intermediate pasty state. For example, eutectic tin-lead solder (63% tin, 37% lead, melting at 183 °C) is used in electronics because it melts at a low temperature and solidifies instantly, preventing movement while setting. In contrast, plumber's wiping solder is chosen off-eutectic to give a wide pasty range that can be wiped and shaped by hand.
3. Intermetallic Compounds
The two metals combine chemically in fixed proportions by mass to form a hard, brittle compound with its own crystal lattice, such as iron carbide or cementite ().
The Tie-Line and the Lever Rule
When an alloy state point sits inside any two-phase region on an equilibrium diagram, reading the diagram requires two steps:
- Phase compositions: Read off the horizontal ends of the tie-line.
- Phase proportions by mass: Calculated using the lever rule.
Step-by-Step Procedure
- Mark the alloy's overall composition () and current temperature on the diagram.
- Draw a horizontal isothermal line across the two-phase region through this point until it touches the boundary lines on either side. This is the tie-line.
- Drop a vertical line from the solid boundary intersection to read the solid composition (), and from the liquidus intersection to read the liquid composition ().
- Apply the inverse lever principle: the proportion of a phase equals the length of the opposite arm of the tie-line divided by the total tie-line length.
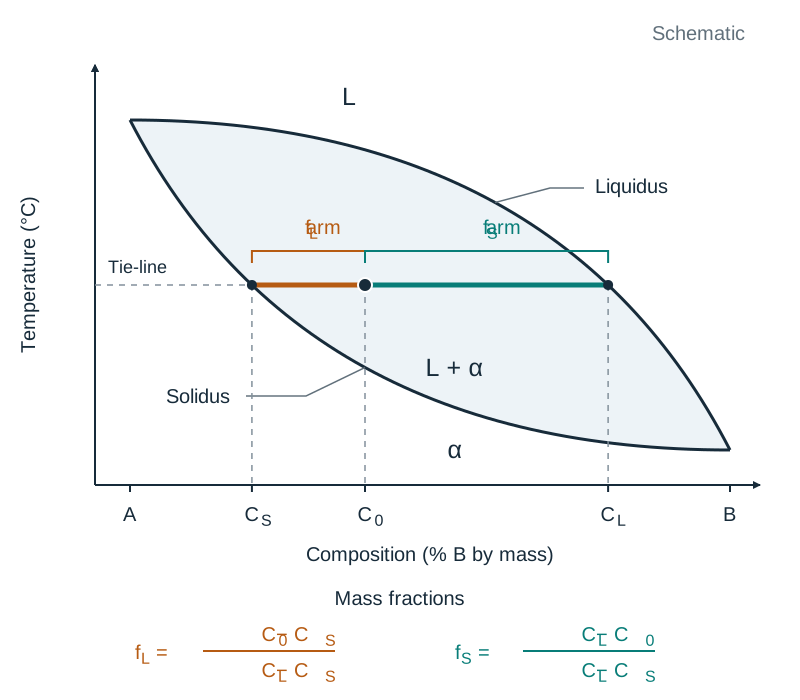
Multiply by 100 to get percentages by mass. Always run a quick sense-check: if the alloy composition point lies closer to the solidus line than to the liquidus line, the alloy must contain more solid than liquid.
In exams, state both the percentages by mass and the final ratio in lowest terms (for example, Solid : Liquid = 25% : 75% = 1 : 3).
Plain Carbon Steels: Allotropy and Microstructures
Plain carbon steels contain iron alloyed with up to approximately 2.0% carbon. The behaviour of steel during heating and cooling depends on allotropy—the ability of pure iron to exist in more than one crystal structure in the solid state.
On heating pure iron from room temperature, three solid allotropic forms occur:
- Alpha () iron — BCC, up to 910 °C. Soft and magnetic. Although Body-Centred Cubic iron is an open structure overall, the individual gaps between its atoms are very small, so it can dissolve almost no carbon (a maximum of about 0.02% C at 723 °C).
- Gamma () iron — FCC, from 910 °C to approximately 1400 °C. Non-magnetic. Face-Centred Cubic iron has fewer gaps between atoms, but each gap is individually larger, allowing carbon atoms to fit in and dissolving up to 2.0% carbon at 1147 °C.
- Delta () iron — BCC, from approximately 1400 °C to the melting point of 1535 °C.
Allotropy is the fundamental reason steel can be heat treated: because iron transforms into FCC austenite at high temperatures, carbon dissolves into solid solution and can then be redistributed upon cooling.
The Core Microstructures in Steels
- Ferrite (): An interstitial solid solution of carbon in BCC alpha iron. Containing negligible carbon (up to 0.02%), it appears white under an optical microscope. Ferrite is soft, ductile, tough, and magnetic.
- Austenite (): An interstitial solid solution of carbon in FCC gamma iron, stable above 723 °C in steels. Austenite is ductile, non-magnetic, and serves as the starting structure for hardening, annealing, and normalising.
- Cementite (Iron Carbide, ): A chemical compound containing 6.67% carbon by mass. Cementite is hard and brittle.
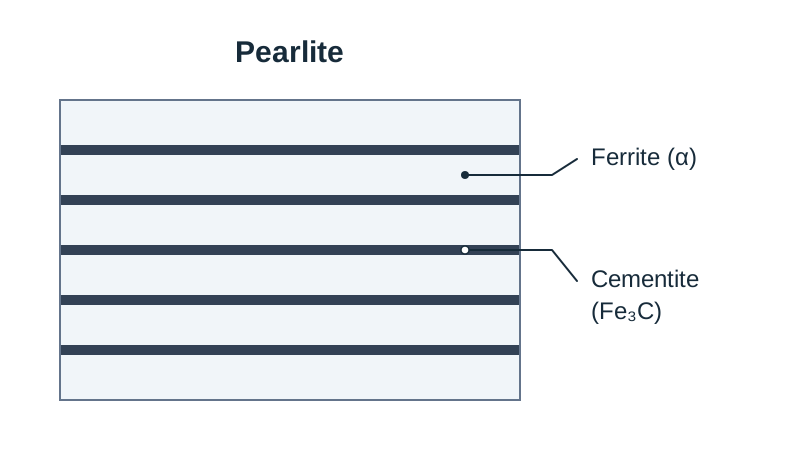
- Pearlite: A eutectoid mixture formed upon slow cooling below 723 °C. It consists of alternating microscopic plates (lamellae) of soft ferrite and hard cementite. Pearlite contains 0.83% carbon overall (accepted range: 0.76% to 0.83% C). By combining soft, tough ferrite with hard cementite, pearlite provides strength and wear resistance.
The Iron-Carbon Diagram: Critical Lines and Regions
The full iron-carbon diagram runs from 0% carbon (pure iron, melting at 1535 °C) across to 6.67% carbon (100% cementite). The steel portion occupies the left-hand side up to roughly 2.0% carbon; alloys above 2.0% carbon are cast irons.
On the full diagram, the liquidus line falls from 1535 °C to the eutectic point at 1147 °C and 4.3% carbon, where molten cast iron solidifies into austenite and cementite. The solidus line in that range runs horizontally at 1147 °C.
Critical Boundary Lines in Plain Carbon Steel
Far below the melting range lie the critical lines that govern solid-state transformations in steel:
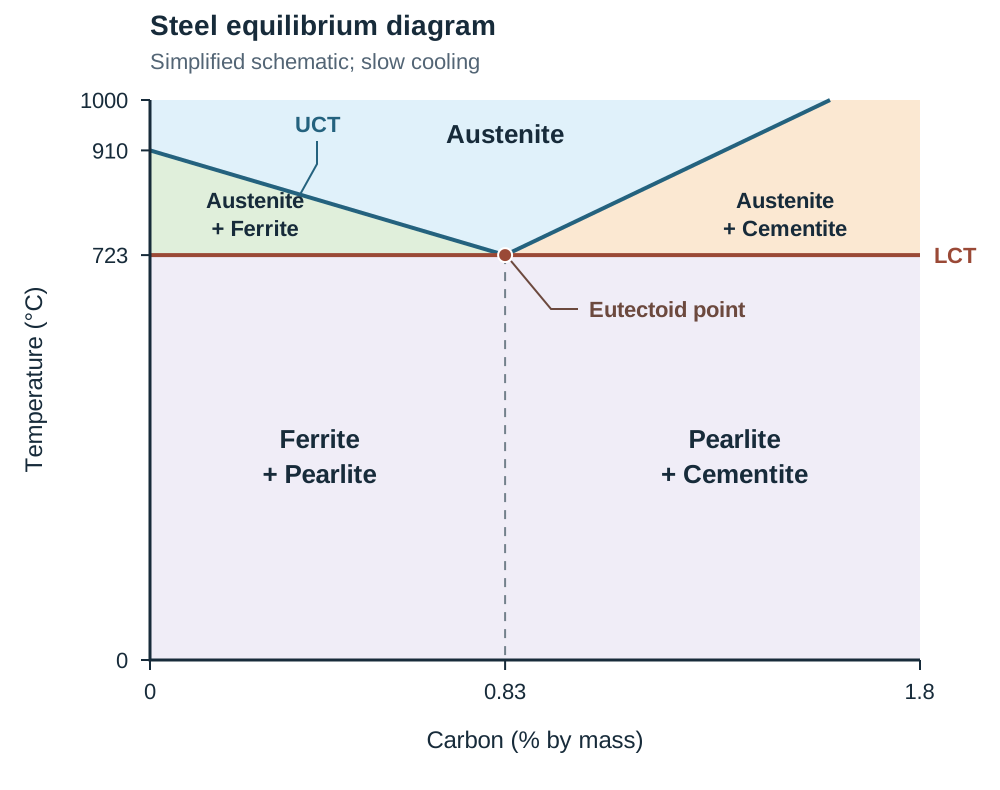
- Upper Critical Temperature (UCT) Line: For hypoeutectoid steels, this line slopes down from 910 °C at 0% C to 723 °C at 0.83% C. For hypereutectoid steels, the upper boundary slopes upward from 723 °C towards 1147 °C. Above this line, the steel consists entirely of single-phase austenite.
- Lower Critical Temperature (LCT) Line: A horizontal line at 723 °C. Austenite cannot exist in equilibrium below 723 °C; on slow cooling, all remaining austenite transforms at this line.
Describing Transformations Along Critical Lines
When asked to explain the transformation along a line in an exam, always state the direction of temperature change (on cooling), the starting phase, and the resulting phases:
- Upper Critical Temperature line: On cooling through this line, austenite begins to transform and proeutectoid ferrite (or cementite in hypereutectoid steels) begins to precipitate at the austenite grain boundaries.
- Lower Critical Temperature line (723 °C): On cooling through this line, all remaining austenite (now at 0.83% C) transforms into pearlite, the lamellar mixture of ferrite and cementite.
Drawing the Steel Diagram in Six Strokes
- Draw axes: temperature (°C) on the vertical axis (0 to 1000 °C), % carbon on the horizontal axis (0% to 1.8% C).
- Mark 910 °C on the vertical axis and draw a horizontal line right across at 723 °C (LCT).
- Mark 0.83% C on the horizontal axis and drop a vertical guide line.
- Draw the UCT sloping down from 910 °C at 0% C to the point (0.83% C, 723 °C).
- Draw the upper boundary line sloping upwards to the right from that same point.
- Label the eutectoid point (0.83% C, 723 °C) and the phase fields.
The Regions of the Steel Diagram
Exam papers letter four or five regions on this diagram. Never rely on memorised letter order; locate each position using the 0.83% C vertical and 723 °C horizontal grid:
| Position on Diagram | Phases Present | Notes |
|---|---|---|
| Above UCT line | Austenite | Single-phase FCC solid solution |
| Between UCT and LCT (left of 0.83% C) | Austenite + Ferrite | Proeutectoid ferrite nucleates from austenite |
| Above LCT (right of 0.83% C) | Austenite + Cementite | Proeutectoid cementite precipitates from austenite |
| Below 723 °C (left of 0.83% C) | Ferrite + Pearlite | Room-temperature hypoeutectoid structure |
| Below 723 °C (right of 0.83% C) | Pearlite + Cementite | Room-temperature hypereutectoid structure |
Steel Families by Carbon Content
- Hypoeutectoid steel: Below 0.83% C (for example, 0.2%, 0.4%, 0.6% C). Cools slowly to ferrite + pearlite.
- Eutectoid steel: Exactly 0.83% C. Cools slowly to 100% pearlite.
- Hypereutectoid steel: Above 0.83% C (for example, 1.2%, 1.4% C). Cools slowly to pearlite + cementite.
Eutectic vs Eutectoid Reactions
- Eutectic reaction (1147 °C, 4.3% C): Single liquid freezes into two solids simultaneously at one fixed temperature: . Occurs in cast irons.
- Eutectoid reaction (723 °C, 0.83% C): An entirely solid-to-solid transformation where single solid austenite decomposes into two solids: .
Cooling Transformations and Heat Treatment of Steels
The equilibrium diagram assumes slow cooling that gives carbon atoms time to diffuse.
Slow Cooling of Hypoeutectoid Steel (0.4% C)
- Above 800 °C: Uniform single-phase austenite.
- Between UCT (~800 °C) and LCT (723 °C): Proeutectoid ferrite nucleates at austenite grain boundaries. Because ferrite rejects carbon, the remaining austenite enriches in carbon, tracking down the UCT line toward 0.83% C.
- At 723 °C: The remaining austenite reaches 0.83% C and transforms completely into pearlite.
- Below 723 °C: No further changes occur. The final structure is proeutectoid ferrite grains surrounded by pearlite colonies.
Slow Cooling of Hypereutectoid Steel (1.2% C)
- Above UCT (~900 °C): Single-phase austenite containing 1.2% dissolved carbon.
- From UCT down to 723 °C: Austenite cannot hold that much carbon as temperature drops, so proeutectoid cementite precipitates along austenite grain boundaries. The remaining austenite loses carbon, tracking down the upper boundary line to 0.83% C.
- At 723 °C: The remaining austenite reaches 0.83% C and transforms into pearlite.
- Below 723 °C: The final structure is pearlite grains surrounded by a hard, brittle cementite boundary network.
Heat Treatments Governed by the Diagram
| Process | Heating Temperature | Cooling Rate | Resulting Structure | Purpose |
|---|---|---|---|---|
| Full annealing | 25–50 °C above UCT (for hypoeutectoid steels) | Very slow, in closed furnace | Coarse ferrite + coarse pearlite | Maximum softness, ductility, and relief of internal stress |
| Normalising | 25–50 °C above UCT | Moderate, in still air outside furnace | Fine ferrite + fine pearlite | Refine grain size, give uniform structure and restore strength |
| Hardening | 25–50 °C above UCT (hypoeutectoid); 25–50 °C above LCT (hypereutectoid) | Rapid quench in water, brine, or oil | Martensite | Maximum hardness and wear resistance |
| Tempering | Reheat quenched steel between 200 °C and 600 °C (below LCT) | Cool in air | Tempered martensite | Relieve quenching stresses and restore toughness while retaining hardness |
Examiner details:
- Hypereutectoid steel is hardened from just above the LCT (723 °C) rather than above the upper line to keep the hard cementite network intact without coarsening austenite grains.
- Stress relieving heats steel to 500–650 °C (well below the LCT) to relieve stresses from machining or welding without changing the crystal structure.
- Martensite is formed when rapid cooling prevents carbon from diffusing out of the FCC lattice. The trapped carbon strains the lattice into a needle-like structure. Martensite never appears on the equilibrium diagram because it is a non-equilibrium phase produced exclusively by rapid quenching.
Carbon Content vs Engineering Properties
| Property | Low-Carbon Steel (0.2% C) | High-Carbon Steel (1.2%–1.5% C) |
|---|---|---|
| Microstructure | Mostly ductile ferrite with small pearlite colonies | Pearlite colonies enclosed by brittle cementite networks |
| Hardness and strength | Low hardness, moderate tensile strength | Very high hardness and wear resistance |
| Ductility and toughness | Highly ductile, malleable, and tough under impact | Low ductility, brittle under impact shock |
| Weldability | Easily welded without pre-heating | Poor weldability; prone to heat-affected cracking |
Key terms
- Equilibrium Diagram
- A graphical map plotting temperature against percentage composition, showing the phases present in an alloy system under slow heating or cooling conditions.
- Cooling Curve
- A graph of temperature plotted against time for an alloy as it cools from the liquid state, used experimentally to determine transformation temperatures.
- Thermal Arrest
- A horizontal flat section on a cooling curve where temperature remains constant because the release of latent heat of fusion balances heat loss to surroundings.
- Liquidus Line
- The boundary line on a phase diagram above which an alloy is completely molten liquid, marking the temperature where crystal solidification begins on cooling.
- Solidus Line
- The boundary line on a phase diagram below which an alloy is completely solid, marking the temperature where solidification finishes on cooling.
- Pasty Region
- The two-phase temperature range between the liquidus and solidus lines where liquid molten alloy and solid crystal dendrites coexist.
- Dendrite
- A branched, tree-like crystal that grows outward from a nucleation centre along preferred crystallographic axes during molten metal solidification.
- Solid Solution
- A single, homogeneous solid phase composed of two or more elements sharing a common crystal lattice, formed substitutionally or interstitially.
- Eutectic Point
- The composition and lowest melting temperature in an alloy system where a single liquid freezes directly into two solid phases simultaneously upon cooling.
- Eutectoid Point
- The fixed composition (0.83% carbon) and temperature (723 °C) where solid austenite decomposes directly into two solid phases (ferrite and cementite).
- Allotropy
- The ability of a chemical element, such as iron, to exist in more than one distinct crystal lattice structure in the solid state at different temperatures.
- Austenite
- An interstitial solid solution of carbon in Face-Centred Cubic (FCC) gamma iron, stable above 723 °C in steels and capable of dissolving up to 2.0% carbon.
- Ferrite
- A solid solution of carbon in Body-Centred Cubic (BCC) alpha iron; it holds a maximum of 0.02% carbon and is soft, ductile, and magnetic.
- Cementite
- Iron carbide (Fe₃C), a hard and brittle chemical compound containing 6.67% carbon by mass.
- Pearlite
- A eutectoid microstructural constituent consisting of alternating microscopic plates of soft ferrite and hard cementite, containing 0.83% carbon overall.
- Tie-Line
- A horizontal isothermal line drawn across a two-phase region on an equilibrium diagram to determine the composition of each coexisting phase.
- Lever Rule
- A mathematical method using the inverse ratio of tie-line arm lengths to calculate the relative mass fractions of two coexisting phases in a two-phase region.
- Upper Critical Temperature (UCT)
- The boundary line above which steel transforms entirely into single-phase austenite; it slopes from 910 °C at 0% C down to 723 °C at 0.83% C.
- Lower Critical Temperature (LCT)
- The horizontal transformation line at 723 °C where any remaining austenite decomposes into pearlite during slow cooling.
- Martensite
- A very hard, needle-like, non-equilibrium microstructure formed when austenite is rapidly quenched, trapping carbon in a heavily strained crystal lattice.
Check yourself
What is the physical meaning of the liquidus line on a thermal equilibrium diagram?
It is the boundary line above which an alloy is completely molten liquid, marking the temperature where crystal solidification begins on cooling.
Why does a pure metal display a flat horizontal arrest on its cooling curve during freezing?
Solidification occurs at one constant temperature where the release of latent heat of fusion balances heat lost to the surroundings.
What crystal structure change takes place when pure iron is heated through 910 °C?
Iron transforms from Body-Centred Cubic (BCC) alpha ferrite into Face-Centred Cubic (FCC) gamma austenite.
State the carbon composition and temperature of the eutectoid point in plain carbon steels.
0.83% carbon (0.76% to 0.83% accepted) at 723 °C.
Name the phase present when hypoeutectoid steel is heated 40 °C above its Upper Critical Temperature.
Single-phase austenite.
An alloy at 25% B lies on a tie-line running from 10% B (solidus) to 50% B (liquidus). What percentage of the alloy is liquid by mass?
Percentage liquid = [(25 - 10) / (50 - 10)] 100 = (15 / 40) 100 = 37.5%.
A 1.0% carbon steel is cooled slowly from 900 °C. Name the structure present at room temperature and calculate the percentage of cementite (using 0.83% C for pearlite and 6.67% C for cementite).
Pearlite surrounded by a proeutectoid cementite network. % cementite = [(1.0 - 0.83) / (6.67 - 0.83)] 100 = (0.17 / 5.84) 100 = 2.9% cementite (and 97.1% pearlite).