

Market structures are economic models that explain how the number, size, and conduct of firms in an industry determine pricing, output, economic efficiency, and consumer welfare. In Leaving Certificate Higher Level Economics, industries are examined along a competitive spectrum stretching from intense rivalry under perfect competition, through monopolistic competition and oligopoly, to total market control in pure monopoly. Understanding these models allows economists to predict market reactions to supply and demand shocks, evaluate why supernormal profits persist behind high barriers to entry, and assess how statutory bodies like Ireland's Competition and Consumer Protection Commission (CCPC) and the European Commission regulate market power.
Why Economists Use Market Structure Models
Real industries are complex and messy. Economists simplify them into theoretical models by focusing on four primary characteristics: the number of buyers and sellers, the nature of the product (homogeneous or differentiated), the degree of freedom of entry and exit, and the level of market information.
Economists use these models to achieve three goals:
- Predict market outcomes: Models help economists forecast how price, output, and employment will react when market conditions change, such as an increase in consumer demand, a spike in raw material costs, or the entry of a foreign competitor.
- Provide an efficiency benchmark: Perfect competition provides a theoretical benchmark of maximum economic efficiency ( at minimum ). By comparing real-world industries against this benchmark, economists can measure the welfare loss caused by market imperfections.
- Design and enforce competition policy: Understanding how concentration affects pricing enables bodies like the CCPC to decide whether proposed corporate mergers should be cleared, modified, or blocked.
Limitations of Market Structure Models
Economic models rely on simplifying assumptions, such as perfect consumer rationality, identical products, and complete market knowledge. In practice, real-world firms face imperfect information, consumer inertia, and brand attachments, meaning model predictions must be applied with realistic economic judgement.
Profit Maximisation and Cost-Revenue Foundations
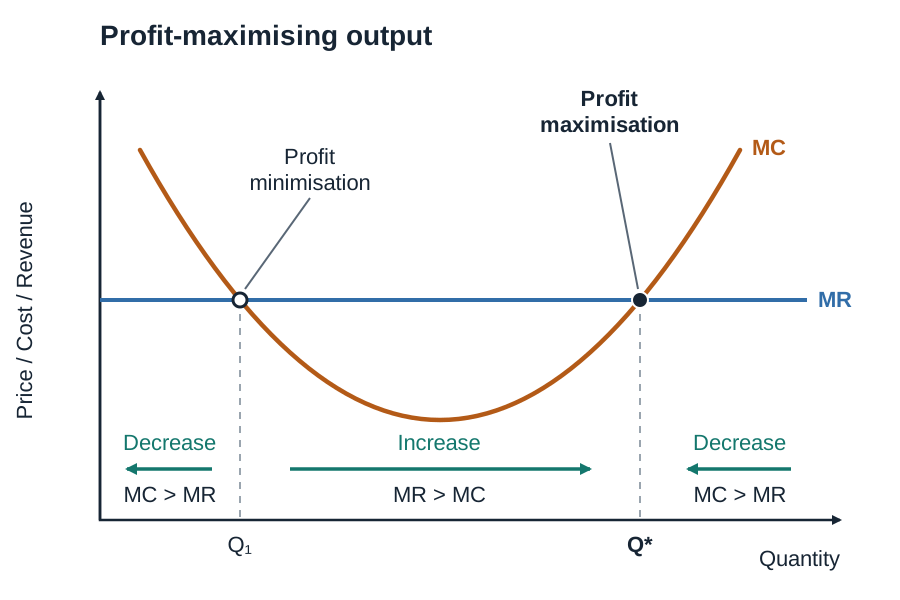
Across every market structure, standard economic theory assumes that firms seek to maximise profit. A firm achieves profit maximisation at the specific output where Marginal Revenue equals Marginal Cost (), provided the Marginal Cost curve cuts the Marginal Revenue curve from below ( is rising).
- Marginal Revenue (): The additional revenue earned from selling one more unit of output.
- Marginal Cost (): The addition to total cost resulting from producing one additional unit of output.
- If , producing an extra unit adds more to revenue than to cost, so expanding production adds to total profit.
- If , the last unit produced adds more to cost than to revenue, so cutting output increases net profit.
- If cuts from above, the firm is at a point of profit minimisation (maximum loss). The profit-maximising equilibrium strictly requires to cut from below.
Normal vs Supernormal Profit
- Normal profit (): The minimum return necessary to keep the entrepreneur and their factors of production in their current line of business. It represents an economic opportunity cost and is included in the firm's Average Cost () curve.
- Supernormal profit (): Any profit earned above normal profit. It reflects abnormal economic returns.
- Economic loss (): Occurs when the selling price does not cover average total production costs.
The Short-Run Shut-Down Point
In the short run, at least one factor of production is fixed, meaning fixed costs must be paid regardless of whether output is zero. A firm incurring a short-run loss will continue producing as long as the market price covers average variable cost (). Any revenue earned above variable cost helps pay down fixed overheads. However, if the price drops below the minimum point of the curve (), the firm reaches its shut-down point and halts production immediately to minimise its losses to fixed costs alone. A firm's short-run supply curve is therefore its curve above the minimum point of .
Perfect Competition
Perfect competition represents an extreme benchmark of intense competition. It rests on five central assumptions:
- Many buyers and sellers: Every individual firm and consumer represents a negligible fraction of total market volume. No single firm has market power; each is a price taker facing a horizontal, perfectly elastic demand curve ().
- Homogeneous goods: All firms produce identical, standardised products. Consumers have no brand preference, eliminating the need for advertising.
- Freedom of entry and exit: There are zero barriers to entry or exit. Capital and enterprise move into and out of the trade freely.
- Perfect knowledge: All consumers and producers have complete information regarding market prices, input costs, and production techniques.
- Profit-maximising objective: Every firm produces where .
Equilibrium Diagrams in Words
An exam answer must be able to trace two side-by-side diagrams:
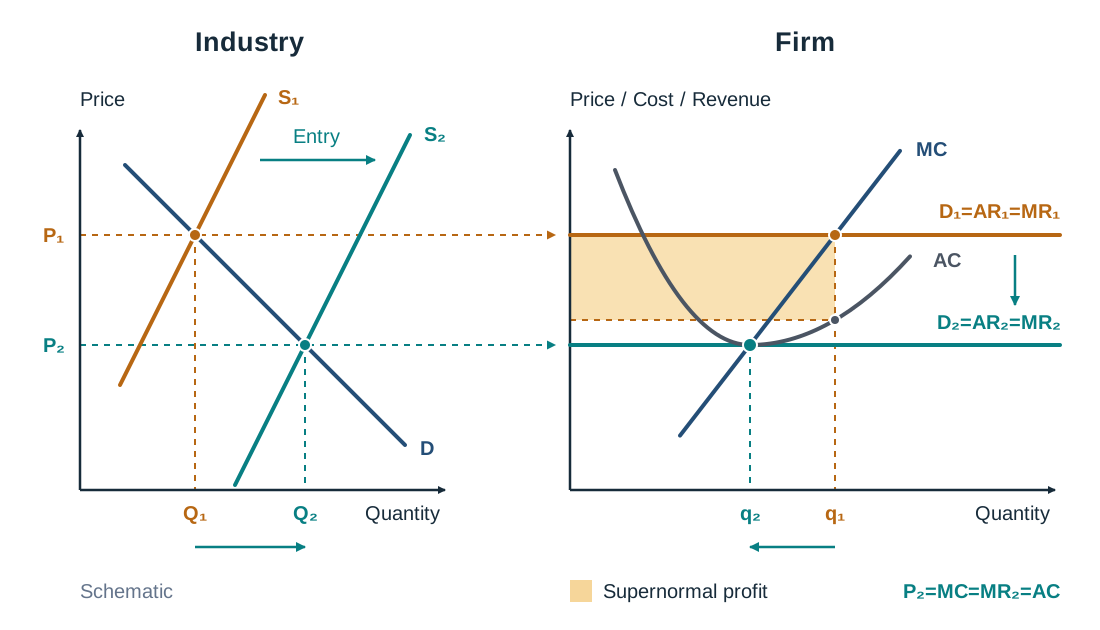
- Industry diagram: Standard downward-sloping market demand () and upward-sloping market supply () intersect to establish the market equilibrium price .
- Firm diagram: The vertical axis shows Price, Cost, and Revenue, while the horizontal axis shows Quantity. The firm takes , creating a horizontal line labelled . A U-shaped curve sits on the diagram, cut at its lowest point by a rising curve. The firm produces output where .
Short-Run Supernormal Profit to Long-Run Adjustment
In the short run, if market demand is buoyant, lies above at output . The firm earns supernormal profit, represented by the shaded rectangle between price and average cost over output .
In the long run, supernormal profit acts as an incentive, attracting new entrants into the industry. Because there are no barriers to entry and knowledge is perfect, new producers enter. This expansion shifts the market supply curve to the right, driving down the equilibrium market price from to . The horizontal demand curve facing each individual firm drops until it is tangent to the lowest point of the curve. Entry ceases when all firms earn only normal profit, establishing the long-run condition:
Impact of a Demand Shock
If market demand rises, the industry demand curve shifts right, raising market price. In the short run, the firm's horizontal demand curve shifts upward, output expands along the curve, and supernormal profit is earned. In the long run, new firms enter, shifting industry supply right until price falls back to minimum . Industry output permanently expands, but individual firms return to normal profit.
Critique of Perfect Competition
- Unrealistic assumptions: Few real markets feature identical products and perfect knowledge. Unprocessed agricultural commodities (such as milk sold to a co-op or grain) come closest.
- Lack of innovation: Because firms earn only normal profit in the long run, they lack retained capital to fund research and development ().
- Absence of economies of scale: Firms remain small and fragmented, unable to exploit large-scale technical efficiencies.
- No consumer variety: Product homogeneity deprives consumers of choice in design, branding, and quality.
- Efficiency benchmark: Despite these drawbacks, it achieves allocative efficiency () and productive efficiency (production at minimum ).
Monopoly
A pure monopoly exists when a single seller dominates the entire market for a good or service that has no close substitutes. The firm is the industry, making it a price maker. It faces the downward-sloping market demand curve (). Because the monopolist must lower the price on all units to sell an extra unit, its Marginal Revenue curve lies below the Average Revenue curve. For a straight-line demand curve, falls twice as steeply as .
Barriers to Entry
A monopoly can sustain supernormal profit in the long run only because substantial barriers to entry block new rivals:
- Legal and statutory barriers: State-granted monopolies, public franchises, or statutory patents and copyrights that give exclusive production rights.
- Natural monopolies and economies of scale: Industries with massive capital infrastructure costs, like Uisce Éireann's water network or the national electricity grid (operated by EirGrid and owned by ESB Networks). A single supplier achieves sufficient economies of scale to supply the entire market at a lower average cost than multiple competing networks.
- Control of essential resources: Exclusive ownership of a critical natural raw material or key physical supply route.
- Predatory pricing and brand loyalty: Established monopolists can use deep financial reserves to temporarily slash prices below cost to force newcomers into bankruptcy. Predatory pricing is an abuse of a dominant position and is illegal under competition law.
Diagrammatic Tracing and Market Inefficiency
To trace monopoly equilibrium in an exam:
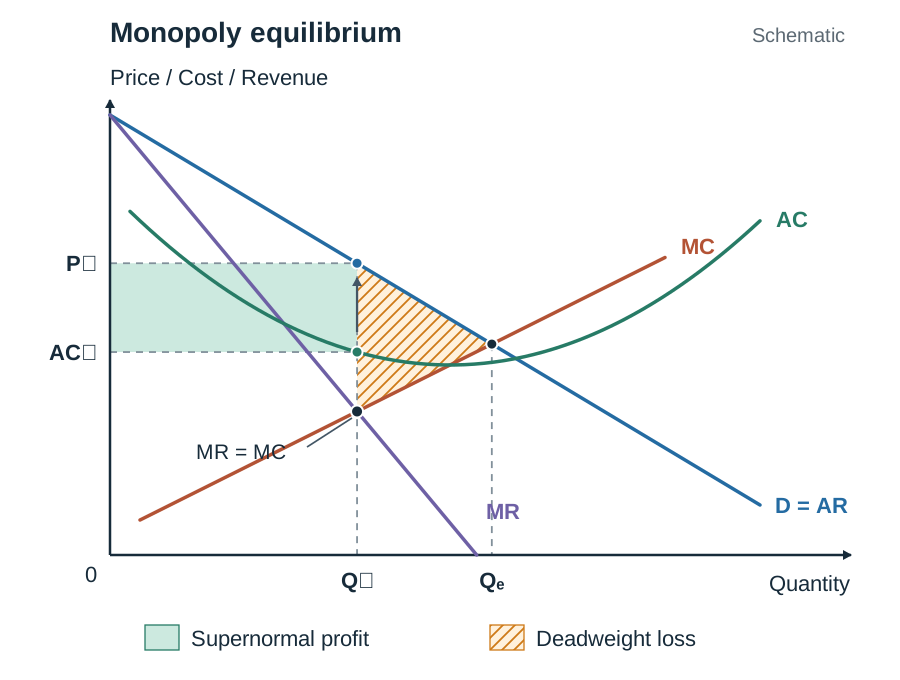
- Find profit-maximising output where (with cutting from below).
- Project vertically up to the demand curve () to read the profit-maximising selling price .
- Project vertically to the Average Cost curve at to read cost per unit ().
- Shade the supernormal profit rectangle: .
Monopolies lead to significant market failures:
- Allocative inefficiency: The firm restricts output and sets price above marginal cost (). Consumers place a higher value on extra units than the opportunity cost of producing them, creating a deadweight loss of consumer and producer surplus.
- Productive inefficiency: Nothing forces the monopolist to produce at the lowest point of its curve; it typically produces with excess unit costs.
- X-inefficiency: Shielded from competitive threats, monopolists frequently suffer from organizational slack, unnecessary administrative bureaucracy, and wasteful spending.
Economic Advantages of Monopoly and Policy Responses
Monopoly is not wholly negative. Monopolies can generate substantial benefits:
- Economies of scale: In a natural monopoly, a single provider prevents wasteful duplication of pipes, cables, or rail lines, delivering lower average costs.
- Dynamic efficiency (): Sustained supernormal profits provide the financial capital required to fund expensive research and innovation, such as new pharmaceutical development.
- Universal service provision: Regulated monopolies can use profits from lucrative routes to cross-subsidise uneconomic rural public services.
To curb abuses of market power, governments intervene through:
- Independent price and quality regulation: Bodies like the Commission for Regulation of Utilities (CRU) regulate water and electricity grid tariffs, while ComReg regulates postal and telecommunications charges.
- Competition law enforcement: The CCPC and the European Commission investigate predatory practices and block anti-competitive mergers.
- State ownership: Crucial national utility networks are kept in public ownership to prioritise public welfare over private profit extraction.
Monopolistic Competition
Monopolistic competition is common in local retail and consumer service sectors, such as cafés, hairdressers, restaurants, and independent clothing boutiques. It blends intense competition with local market power.
Key Characteristics
- Many buyers and sellers: Each business acts independently without dominating the overall trade.
- Product differentiation: Goods and services are close, but not perfect, substitutes. Differentiation occurs through physical styling, customer service standards, unique branding, or convenient physical location.
- Freedom of entry and exit: Barriers to entry are low in the long run.
- Downward-sloping demand curve: Because product differentiation builds customer loyalty, the individual firm is a price maker with a relatively elastic demand curve. It can raise prices slightly without shedding all its clientele.
Long-Run Equilibrium and Excess Capacity
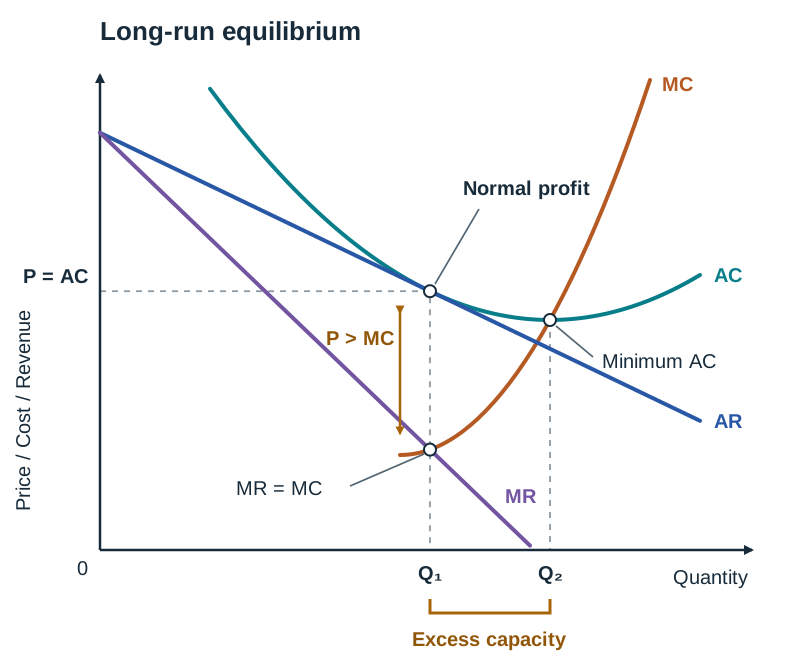
In the short run, a differentiated business (such as a trendy bistro) earns supernormal profits where . In the long run, low entry barriers prompt new rivals to open nearby. These new entrants steal footfall and introduce close substitutes, shifting the existing firm's demand curve () to the left and making it more price elastic. Entry continues until the firm's downward-sloping curve is exactly tangent to the downward-sloping section of its U-shaped curve.
At this long-run equilibrium:
- The firm earns only normal profit ().
- Output is produced where , meaning the market is not allocatively efficient.
- The firm produces to the left of the minimum point of its curve. The shortfall between actual output and the output that minimises average cost is termed excess capacity.
Evaluating the Variety Trade-Off
While monopolistic competition fails both productive efficiency (due to excess capacity) and allocative efficiency (), consumers gain substantial welfare benefits from variety, personal service, and product innovation. Many economists argue that the utility consumers derive from having varied dining, shopping, and grooming options compensates for slightly higher average costs.
Oligopoly and the Kinked Demand Curve
An oligopoly is an industry dominated by a small number of large, powerful firms. Familiar examples in Ireland include commercial banking (AIB, Bank of Ireland, PTSB), grocery supermarkets (Dunnes Stores, Tesco, SuperValu), and air travel routes to and from Ireland (dominated by Ryanair and Aer Lingus).
Structural Features
- Interdependence: Because each firm holds a large share of the market, the pricing, marketing, and output decisions of one firm trigger immediate retaliatory reactions from its rivals.
- High barriers to entry: Significant economies of scale, extensive advertising budgets, and established supply chains discourage prospective entrants.
- Non-price competition: Oligopolists avoid direct price wars because aggressive discounting slashes profit margins for all incumbents. Instead, they compete via advertising, customer loyalty card programmes, superior packaging, and extended opening hours.
- Collusion: The temptation exists for firms to eliminate uncertainty by colluding. Explicit collusion involves entering a formal agreement or cartel to fix prices or divide sales territories; this is strictly illegal. Tacit collusion occurs without direct communication, often through price leadership, where firms follow the price adjustments initiated by the largest dominant firm.
The Kinked Demand Curve Model
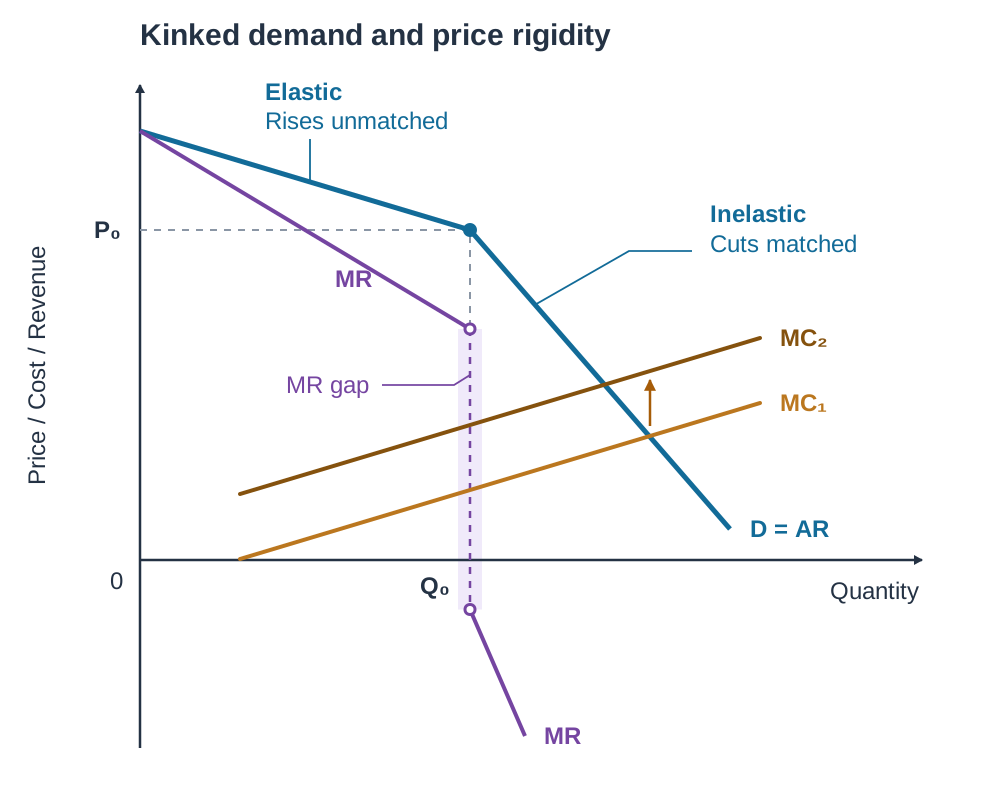
Economists use the kinked demand curve model to explain price rigidity in oligopolistic markets. The model assumes asymmetric reactions from rivals around the established price :
- Price increase (elastic upper segment): If a firm raises its price above , its rivals will not follow. Competitors keep their prices steady to capture the defecting customers. Demand is price elastic, and the firm suffers a sharp contraction in sales and total revenue.
- Price decrease (inelastic lower segment): If the firm cuts its price below , rivals match the cut immediately to defend their market shares. Demand is price inelastic, sales expand very little, and a price war erodes total revenue.
Because the demand curve kinks sharply at , the corresponding Marginal Revenue curve splits, creating a vertical discontinuity directly beneath the kink. As long as shifts in the firm's Marginal Cost curve (arising from moderate changes in labour or raw material costs) stay within this vertical gap, the profit-maximising price () and quantity () do not change. For instance, an airline facing a temporary, modest rise in jet fuel costs may absorb the expense without altering ticket prices.
Advantages and Disadvantages of Oligopoly
Advantages:
- Innovation: Long-run supernormal profits provide the financial reserves required to fund expensive .
- Price stability: Price rigidity allows households and corporate buyers to budget and plan expenditure with confidence.
- Economies of scale: Large market scale drives down unit operating costs, which can lead to competitive retail pricing if cost savings are passed on.
- Consumer choice: Vigorous non-price competition yields loyalty discounts, high service standards, and product variety.
Disadvantages:
- Risk of cartels: Unlawful collusion allows firms to restrict industry output and charge monopoly-level prices.
- Restricted entry: Entrenched barriers protect inefficient incumbents from innovative market entrants.
- Advertising costs: Heavy marketing expenditure inflates overheads, costs that are ultimately passed on to consumers in shelf prices.
- Allocative inefficiency: Prices settle above marginal cost ().
Comparing Market Structures and Efficiency
A comparative overview highlights how market power reshapes economic outcomes:
| Feature | Perfect Competition | Monopolistic Competition | Oligopoly | Pure Monopoly |
|---|---|---|---|---|
| Number of Firms | Very many | Many | Few dominant | Single seller |
| Product Nature | Homogeneous | Differentiated | Homogeneous or differentiated | Unique, no close substitute |
| Barriers to Entry | None | Low | High | Very high / insurmountable |
| Firm's Demand Curve | Horizontal () | Downward-sloping (elastic) | Kinked (elastic above, inelastic below) | Downward-sloping (market demand) |
| Long-Run Profit | Normal profit only | Normal profit only | Typically supernormal | Sustained supernormal |
| Productive Efficiency | Yes (min ) | No (excess capacity) | Unlikely | Unlikely |
| Allocative Efficiency | Yes () | No () | No () | No () |
Implications of Rising Market Power
As an industry moves from perfect competition toward monopoly, market power concentrates in fewer hands. Incumbent firms restrict market output below competitive levels and raise prices above marginal cost. The resulting fall in output creates a deadweight loss: units that consumers value above their cost of production are no longer made, so this consumer and producer surplus is lost to society altogether.
Price Discrimination, Concentration, and Competition Policy
Price Discrimination
Price discrimination occurs when a seller charges different prices to different customers for the exact same good or service, where the price differences are not due to differences in the cost of supply.
Three conditions are essential for price discrimination to occur:
- Market power: The firm must be a price maker. In a perfectly competitive market, rival sellers would undercut any price increase.
- Market separation (preventing arbitrage): The seller must be able to prevent consumers who purchase at the lower price from reselling the product to customers charged the higher price. Separation is achieved through personal identity (student cards), time of consumption (peak vs off-peak rail), or geographic boundaries.
- Differing price elasticities of demand (PED): The firm must segment buyers into groups with distinct price sensitivities. It charges a higher price to the group with price-inelastic demand (e.g. business travellers) and a lower price to the group with price-elastic demand (e.g. students).
Measuring Market Concentration
Regulators assess market power using two analytical tools:
- Four-Firm Concentration Ratio (): The combined percentage market share of the top four firms (). For example, if the top four health insurers hold shares of 49%, 28%, 20%, and 3%, the is .
- Herfindahl-Hirschman Index (HHI): The sum of the squared market shares of all firms in the market, expressing market shares as whole percentage numbers:
In Leaving Certificate examination questions, markets are classified using the standard analytical thresholds:
- Below 1,500: Competitive, unconcentrated market.
- 1,500 to 2,500: Moderately concentrated market.
- Above 2,500: Highly concentrated market.
While the concentration ratio merely sums the shares, the HHI squares them, giving much greater mathematical weight to dominant firms. In the health insurance example, squaring the shares reveals an HHI of , demonstrating high concentration.
Limitations of Concentration Measures
The HHI depends on how the relevant market is defined geographically and by product scope. It also measures market structure rather than actual competitive conduct; a concentrated market with low entry barriers may still behave competitively.
Irish and European Competition Policy
High market concentration concerns regulators because it increases the risk of higher retail prices, suppressed output, collusion, and predatory behaviour. In law, being dominant is legal; however, abusing a dominant position or forming a cartel is strictly illegal.
- Ireland: Competition Act 2002 (as amended): Enforced by the CCPC. It prohibits anti-competitive agreements, outlaws cartels, bans the abuse of a dominant position, and requires notification of mergers exceeding set financial thresholds. The CCPC can clear a merger, demand asset disposals, or block the transaction outright.
- European Union: Articles 101 and 102 of the Treaty on the Functioning of the European Union (TFEU):
- Article 101: Prohibits agreements between undertakings that prevent, restrict, or distort competition (such as price-fixing cartels).
- Article 102: Prohibits the abuse of a dominant market position.
- Enforced by the European Commission, which can levy massive corporate fines (such as fining Google over €2.4 billion in 2017 for shopping search self-preferencing) and block cross-border mergers (such as blocking Ryanair's proposed takeovers of Aer Lingus in 2007 and 2013 to protect consumer choice on key flight routes).
Key terms
- Price Taker
- A firm that has no market power to influence the ruling market price and must sell all its output at the equilibrium price set by overall market supply and demand.
- Price Maker
- A firm that possesses sufficient market power to influence or dictate the selling price of its product by varying the quantity it supplies.
- Homogeneous Goods
- Identical, standardised products supplied by different firms that consumers view as perfect substitutes for one another.
- Product Differentiation
- The process of making a good or service distinct from competing substitutes through branding, packaging, design, location, or customer service.
- Barriers to Entry
- Economic, legal, or institutional obstacles that make it difficult or costly for new firms to enter an industry to compete against established incumbents.
- Supernormal Profit
- Any profit earned in excess of normal profit, occurring when total revenue exceeds total economic cost, meaning average revenue exceeds average cost ().
- Normal Profit
- The minimum level of profit required to keep an entrepreneur in their current line of business, treated in economics as an economic cost included in average cost ().
- Shut-Down Point
- The output level where market price equals minimum average variable cost (); if price drops below this level, the firm halts production immediately.
- Allocative Efficiency
- A state of resource allocation where the combination of goods produced reflects consumer preferences, achieved when price equals marginal cost ().
- Productive Efficiency
- The production of goods at the lowest possible cost per unit, achieved at the minimum point of the Average Cost curve.
- Excess Capacity
- The difference between the profit-maximising output under monopolistic competition and the larger output level that would minimise average cost.
- Natural Monopoly
- An industry where huge capital infrastructure costs and extensive economies of scale allow a single supplier to serve the entire market at a lower average cost than multiple competing firms.
- Deadweight Loss
- The permanent loss of economic welfare (consumer and producer surplus) that occurs when output is restricted below the allocatively efficient level ().
- X-Inefficiency
- The build-up of organisational slack, unnecessary overheads, and administrative waste that occurs when a firm is shielded from competitive pressure.
- Predatory Pricing
- An illegal pricing strategy where a dominant firm temporarily sells goods below cost to force new or smaller competitors out of the market.
- Interdependence
- A defining characteristic of oligopoly where the pricing, marketing, and output decisions of one firm directly impact and trigger reactions from rival firms.
- Kinked Demand Curve
- An oligopoly model that explains price rigidity, based on the assumption that rivals match price cuts but do not follow price increases.
- Cartel
- An explicit, illegal collusive agreement between rival firms in an oligopoly to fix selling prices, restrict output, or divide market territories.
- Price Leadership
- A form of tacit collusion where firms in an oligopoly implicitly follow the pricing decisions initiated by the market's largest dominant firm.
- Price Discrimination
- The practice of charging different prices to different consumers for an identical good or service, where the price differences are not due to differences in the cost of supply.
- Abuse of a Dominant Position
- Anti-competitive conduct by a dominant firm, such as predatory pricing or tying sales, prohibited under the Competition Act 2002 and Article 102 TFEU.
- Herfindahl-Hirschman Index (HHI)
- A quantitative measure of market concentration calculated by summing the squares of the individual percentage market shares of all firms in an industry.
- Competition and Consumer Protection Commission (CCPC)
- The statutory Irish agency responsible for enforcing national competition law, investigating cartels, assessing corporate mergers, and defending consumer rights.
Check yourself
What two mathematical conditions are required for a firm to achieve profit maximisation?
Marginal Revenue must equal Marginal Cost (), and the Marginal Cost curve must cut the Marginal Revenue curve from below.
At what point will a perfectly competitive firm shut down in the short run?
When the market price falls below the minimum point of its Average Variable Cost curve ().
Why is being a dominant firm legal under EU and Irish law, while abusing dominance is not?
Dominance won through efficiency or innovation is lawful. The law bans only the abuse of that dominance, meaning conduct that exploits consumers or excludes rivals, such as predatory pricing, refusal to supply or tying products. Cartels are banned separately, as anti-competitive agreements between firms.
Outline two advantages and two disadvantages of an oligopolistic market structure.
Advantages: supernormal profits fund innovation and R&D, and prices remain stable due to the kinked demand curve. Disadvantages: risk of illegal collusion or cartels, and allocative inefficiency because price is held above marginal cost.
State the three conditions required for a firm to practice price discrimination.
The firm must possess market power, be able to separate markets to prevent resale (arbitrage), and face consumer groups with differing price elasticities of demand.
An industry contains three firms with market shares of 50%, 30%, and 20%. Calculate the HHI and classify the market.
HHI = 50² + 30² + 20² = 2,500 + 900 + 400 = 3,800. Because 3,800 exceeds the 2,500 benchmark, the market is highly concentrated.