

Market failure occurs when the price mechanism fails to allocate scarce resources efficiently or equitably, resulting in a net loss of economic welfare. Left entirely to private incentives, free markets overproduce harmful goods, underprovide beneficial services, and fail to supply pure public goods altogether. This study note covers the core causes of market failure specified on the Leaving Certificate syllabus: externalities, monopoly power, and imperfect information, alongside public goods and factor immobility. It also applies a cost-benefit approach to examine how governments attempt to correct these market outcomes.
The Meaning of Market Failure
Imagine a commercial paint factory discharging untreated waste into a nearby river. The owner pays for chemical inputs, electricity, and factory labour. Yet the firm pays nothing for the destroyed fish stocks or the local council clean-up downstream. Because the business ignores those clean-up costs, its paint remains artificially cheap, and the firm produces more paint than society would prefer. That unpaid clean-up bill is an external cost, and this breakdown in the market mechanism is what economists describe as a market failure.
If there are no externalities, allocative efficiency occurs where price equals marginal cost (). More generally, society's welfare is greatest where Marginal Social Benefit equals Marginal Social Cost (). At that output, society gets the combination of goods and services it values most.
When markets fail, scarce resources end up misallocated, producing a deadweight welfare loss. In your exam answers, be ready to distinguish between two forms of market failure:
- Complete market failure: The private market produces nothing at all because suppliers cannot charge users directly. This creates a missing market, seen with pure public goods like national defence and public street lighting.
- Partial market failure: The market supplies the good, but gets either the price or the quantity wrong. Demerit goods like cigarettes get overconsumed, while merit goods like childhood immunisations get underconsumed.
Externalities: Negative and Positive
An externality is a spillover cost or benefit that lands on an uninvolved third party. A third party means anyone outside the commercial transaction who had no say in buying or selling the product. When buyers and sellers focus only on private costs and private benefits, market prices transmit incomplete signals, leading to overproduction or underproduction.
Internalising an externality means reshaping market incentives so that buyers or sellers absorb the full social cost or enjoy the full social benefit of their actions.
Negative Production Externalities
When a power plant burns fuel, it pays its staff and fuel suppliers. We classify those direct business outlays as Marginal Private Cost (). Society, however, bears the Marginal Social Cost ():
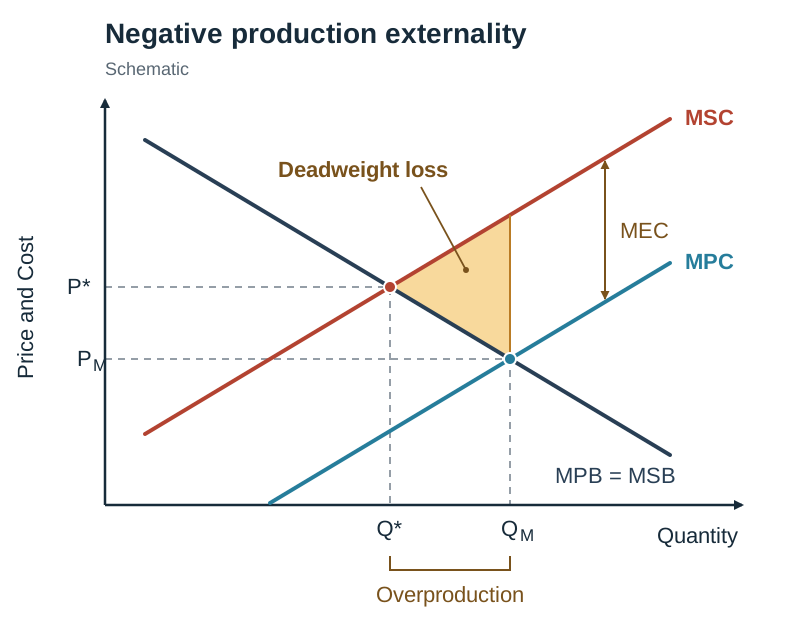
Because , the private supply curve () sits vertically below the true social cost curve ().
- Diagram structure: Label Price and Cost on the vertical axis and Quantity on the horizontal axis. Draw a standard downward-sloping demand curve (). Draw an upward-sloping supply curve for private costs (), and draw a second upward-sloping curve () parallel and vertically above it. The vertical gap between them represents the marginal external cost (). The unregulated market settles where intersects demand, producing quantity at price . The social optimum requires , which yields a lower quantity at a higher price . The free market therefore overproduces ().
- The deadweight loss is the triangle between output levels and . It is bounded above by and below by . The sharp point of the triangle points left at the social optimum (), widening out toward the free-market volume (). This area represents output where extra social cost exceeds extra social benefit.
Negative Consumption Externalities
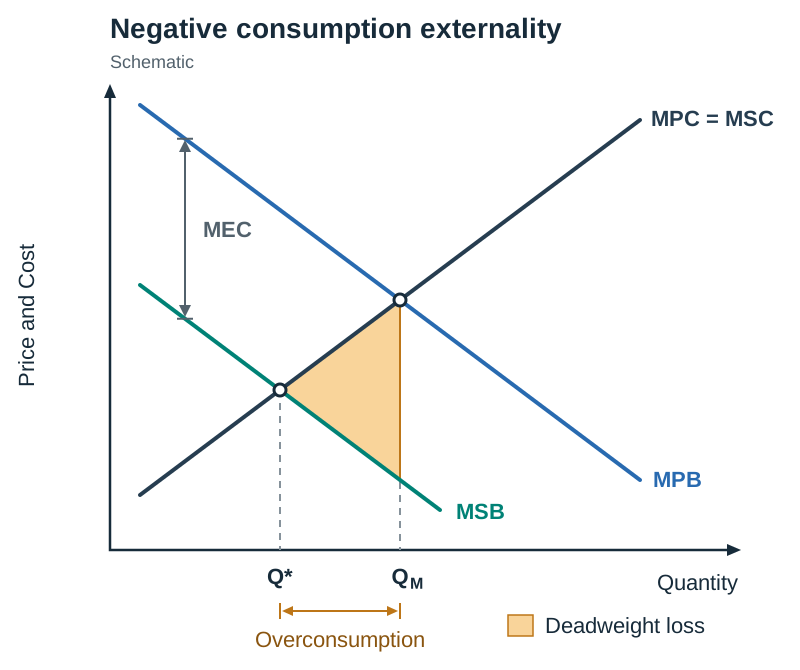
When a person consumes alcohol or smokes in a shared space, the direct production costs are fully paid (). The issue arises when the product is used. Third parties endure second-hand smoke, public disorder, or the burden of funding emergency hospital care. Here, the benefit side diverges:
Because , the true social benefit curve () sits vertically below the private demand curve (). The free market settles where at quantity . That output is higher than the socially optimal level , where .
Positive Externalities
A positive externality delivers spillover benefits to people outside the transaction. Consider an individual taking a winter flu vaccine: they protect their own health, but they also prevent the virus spreading to vulnerable colleagues.
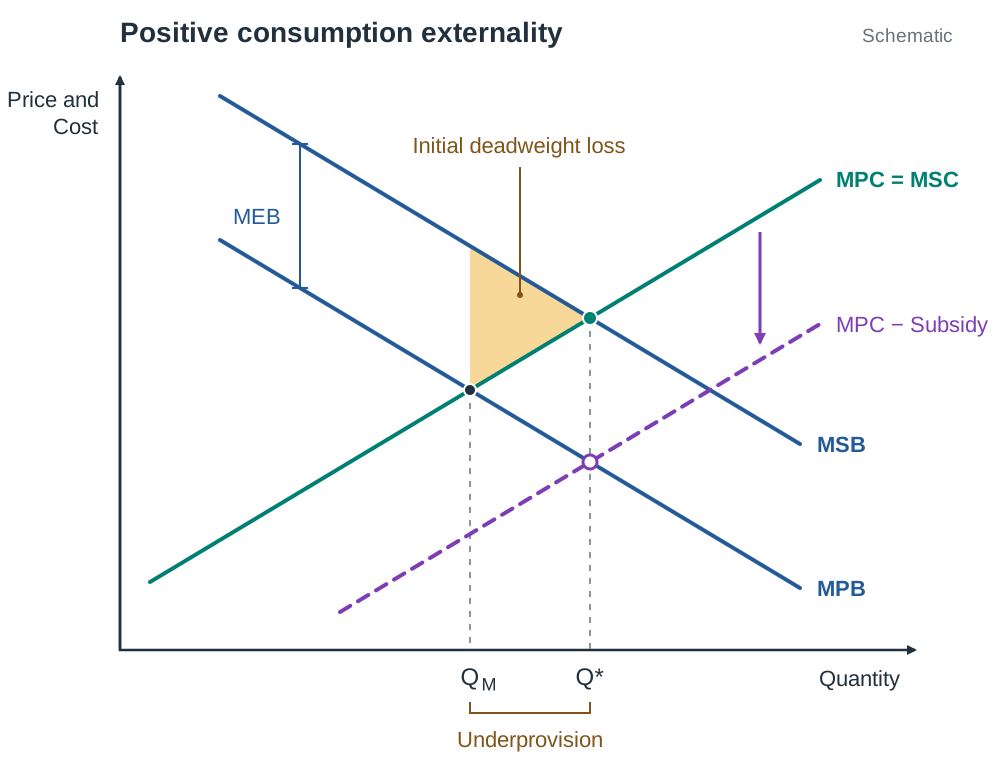
- With positive consumption externalities, social benefit exceeds private benefit: .
- Diagram structure: Draw supply () and private demand (). Place the curve vertically above by the cash value of . The free market stops where at . The social optimum sits higher up where at . Because , the market underproduces the service. The deadweight loss triangle points right toward .
- A targeted government subsidy reduces production expenses. It shifts the private supply curve () downward and rightward until it intersects private demand at the socially optimal volume .
Monopoly Power and Market Concentration
Monopoly power is another direct cause of market failure. In competitive product markets, businesses take prices as given and produce where price equals marginal cost (). A profit-maximising monopolist, on the other hand, possesses market power to restrict output and set the selling price.
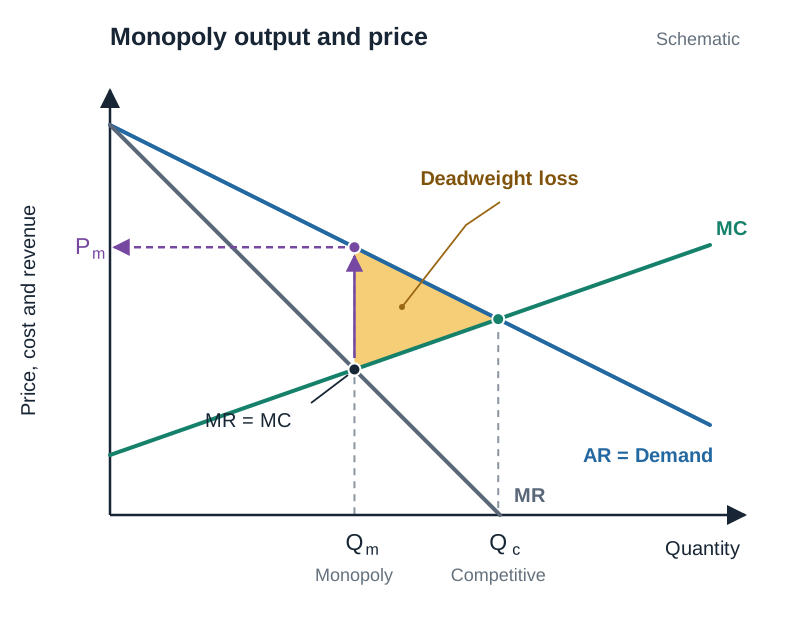
- Monopoly diagram mechanics: The firm faces a downward-sloping demand curve () and a steeper Marginal Revenue curve (). It sets output where , producing . It charges price , read off the demand curve directly above .
- Because price exceeds marginal cost () and production settles below the competitive level, part of consumer surplus is transferred to the firm as profit. The surplus on units between and the competitive output is lost altogether: this is the deadweight loss triangle.
Measuring Concentration: The Herfindahl-Hirschman Index (HHI)
One indicator regulators use when assessing market concentration is the Herfindahl-Hirschman Index (). You calculate it by squaring the percentage market share of every firm in the industry and adding those squared numbers together:
For the practice calculations here, use the following bands from the historical 2010 US merger guidelines. These are not universal current Irish or EU regulatory thresholds. If a question supplies bands, use those. Otherwise, state the bands you are applying; the following are the practice convention used here (the low band is also called competitive in some questions):
- Competitive (unconcentrated):
- Moderately concentrated:
- Highly concentrated:
A higher HHI indicates greater concentration. This can weaken competitive pressure, but HHI alone does not prove dominance, collusion or higher prices. When firms propose mergers in concentrated sectors, statutory bodies like Ireland's Competition and Consumer Protection Commission (CCPC) and the European Commission review the plans and can block the transaction.
Imperfect Information, Merit Goods, and Demerit Goods
Standard demand and supply theory assumes that buyers and sellers have complete knowledge of prices, quality, and future risks. In practical markets, consumers and producers regularly make choices using incomplete or distorted information.
Merit and Demerit Goods
These products carry two connected problems: they generate third-party spillovers, and buyers misunderstand their personal long-term wellbeing at the point of sale.
- Demerit goods: Products whose consumption harms third parties, and whose long-term health or financial costs are downplayed by buyers. Familiar examples include tobacco, alcohol, and high-sugar drinks. Left alone, the free market overproduces them (). Because many demerit goods are addictive, their price elasticity of demand is low ().
- Merit goods: Products that deliver positive third-party spillovers, and whose personal rewards buyers undervalue over their lives. Examples include supplementary pension savings, routine dental check-ups, and early childhood education. Unregulated markets underprovide them ().
Asymmetric Information and Adverse Selection
Asymmetric information happens whenever one party to a transaction holds essential facts that the other party cannot see.
Consider private medical insurance. An applicant knows their personal medical history and daily habits far better than an insurance underwriter can. This asymmetry causes adverse selection. Individuals with higher health risks buy comprehensive cover, while younger, healthier customers often forgo insurance. That pushes up average claim costs. To recover outlays, insurers raise premiums, driving away more low-risk customers and risking market collapse.
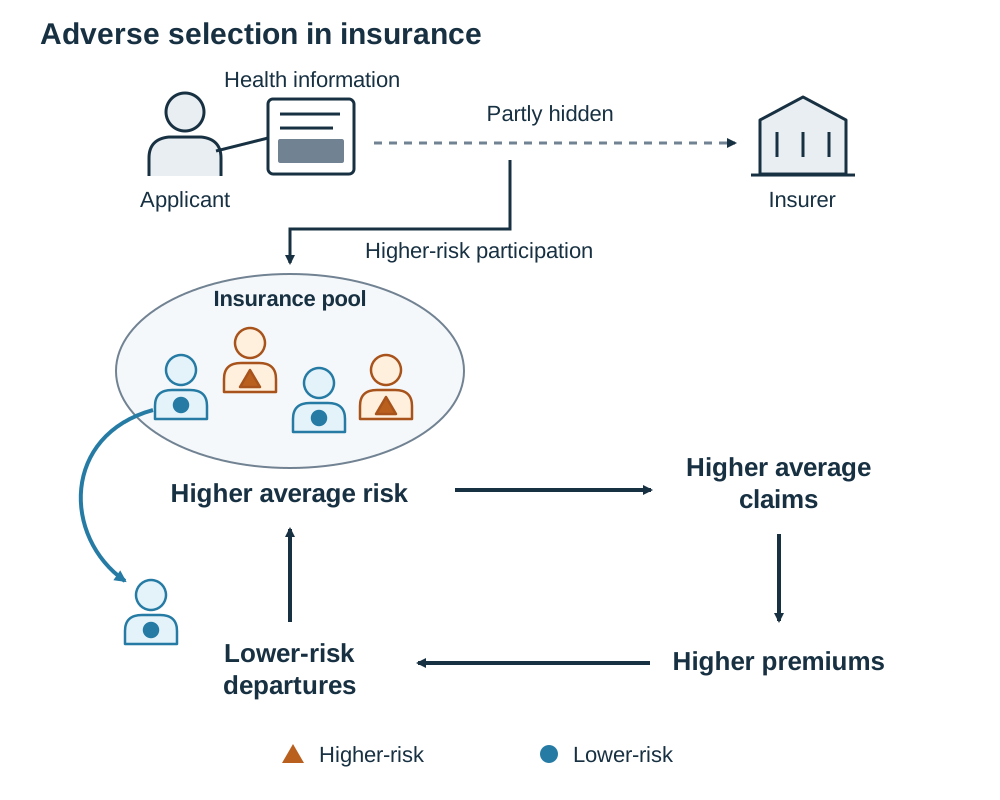
Ireland manages this issue through community rating. Under Irish law, insurers generally charge the same base premium for a given policy regardless of health or age, subject to permitted discounts such as child and young-adult rates and the Lifetime Community Rating rules. To stop younger adults postponing cover until they fall ill, the state adds Lifetime Community Rating loadings if a customer first takes out cover at age 35 or over. This rule encourages younger people into the risk pool and keeps general premiums viable.
Public Goods and Factor Immobility
Public Goods and the Free-Rider Problem
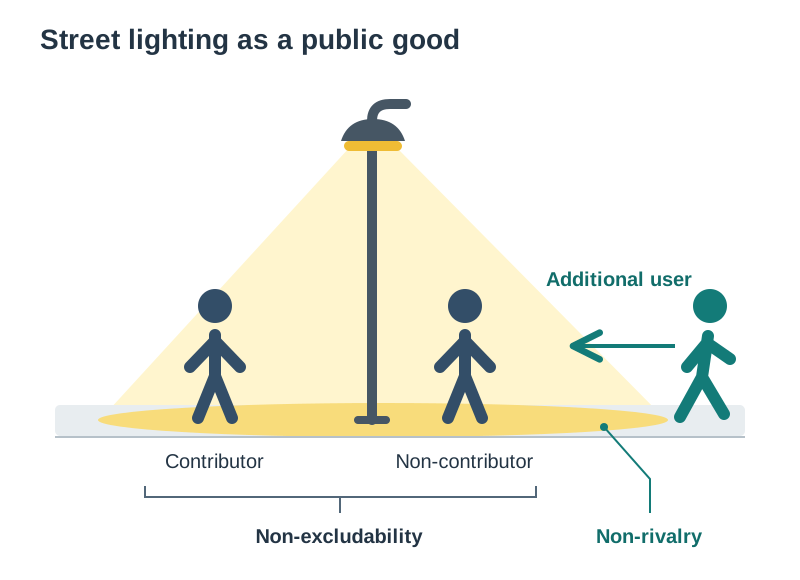
A pure public good meets two strict conditions:
- Non-excludability: Once provided, you cannot prevent non-paying individuals from using the good.
- Non-rivalry: One person consuming the good does not reduce the quantity or quality left for anyone else.
Because nobody can be excluded, people act as free riders. They consume the benefit, pay nothing, and leave others to fund the service. This makes it difficult for private firms to recover the cost of supplying the service, so the market may underprovide it. Pure public goods such as street lighting and national defence are commonly provided by the state and paid for through taxation.
Factor Immobility
Another cause sometimes discussed is factor immobility, which links to the labour market topic (3.2). Workers or capital cannot move easily to where they are needed, so some resources sit idle while other sectors are short of them. Use it as supporting evidence after the main causes.
- Occupational immobility of labour: Workers who lose jobs in contracting sectors frequently lack the specialized qualifications required in growing industries. Following the 2008 contraction in Irish construction, many tradespeople could not transition immediately into open vacancies in biopharma or software development.
- Geographical immobility of labour: Workers struggle to move to employment centres due to family roots, transport deficits, or high rental and housing costs in urban hubs like Dublin and Cork.
- Capital immobility: Specialised physical assets, such as a decommissioned peat-burning electricity plant, cannot be re-tooled for manufacturing advanced technology without heavy financial write-offs.
Government Interventions and Policy Evaluation
Governments use a range of fiscal, legal, and operational tools to intervene when markets misallocate resources:
| Policy Tool | How It Operates | Irish / EU Example | Trade-offs & Limitations |
|---|---|---|---|
| Indirect Taxation | Lifts retail prices and shifts private supply upward (), contracting consumption toward . | Irish carbon tax (rising toward €100 per tonne of by 2030); Sugar-Sweetened Drinks Tax. | Inelastic demand dampens the drop in consumption; takes a bigger share of disposable income from low earners. |
| Subsidies | Lowers production costs and shifts private supply down, expanding output toward . | SEAI home retrofitting grants; reduced public transport fares. | Imposes an opportunity cost on the public purse; firms may absorb funds into operating margins. |
| Legislation & Regulation | Enforces direct legal boundaries or prohibitions to alter behaviour quickly. | 2004 Irish workplace smoking ban; EU bans on single-use plastics. | Incurs inspection and monitoring costs; firms have no incentive to improve beyond the legal baseline. |
| Direct State Provision | The state funds and delivers the service to resolve missing markets or ensure universal access. | An Garda Síochána; primary road infrastructure; primary education. | Without commercial profit discipline, public agencies can encounter bureaucratic delays and project overruns. |
| Competition Policy | Regulators investigate cartels, stop anti-competitive mergers, and discipline market dominance. | CCPC investigations; EU Commission blocking Ryanair's proposed takeover of Aer Lingus. | Defining relevant product markets takes extensive legal work; global digital platforms are difficult to regulate. |
Alongside domestic fuel duties and carbon taxes on heating, the EU Emissions Trading System (EU ETS) caps total greenhouse emissions across major energy and industrial sites and lets companies trade permits, applying price discipline to lower carbon output.
Applying a Cost-Benefit Approach to Policy
Under Syllabus outcome 1.2, students evaluate government decisions by weighing social benefits against social costs and examining who gains the benefits and who bears the costs.
Take the Irish carbon tax as an applied case:
- Who benefits: Society gains from reduced emissions, improved air quality, and lower long-term climate damages. Lower-income households receive targeted supports, such as fuel allowance increases and free home retrofits.
- Who bears the costs: Consumers of fossil fuels pay more for home heating oil and vehicle fuel. Commuters in rural areas lacking public transport alternatives face immediate cost pressures. Because low-income homes spend a larger fraction of their income on home energy, the tax is regressive unless the government actively recycles revenues through social transfers.
In Section B essays, avoid treating any single intervention as spotless. Indirect taxes raise public revenue but squeeze lower incomes; subsidies promote cleaner choices but draw funds away from alternative public spending; direct regulations deliver swift results but require ongoing legal enforcement.
Government Failure
Government failure arises when public policy intervention produces a net loss of social welfare, leaving resource allocation worse than in the uncorrected market.
- Information failure: The state rarely possesses exact data on the true monetary cost of an externality. Setting an environmental tax too high can damage viable employment, while setting it too low leaves pollution unchecked.
- Unintended side effects: In rental property markets, rent control regulations designed to safeguard tenants can cause private landlords to withdraw properties, worsening accommodation shortages.
- Bureaucratic delays: Protracted planning reviews and public procurement delays consume state resources and hold up essential infrastructure schemes.
Key terms
- Market Failure
- A situation where the free price mechanism misallocates scarce resources, leading to a net loss of economic welfare.
- Externality
- A spillover cost or benefit from the production or consumption of a good that falls on an uninvolved third party.
- Third Party
- A person, business, or community outside a market trade who is affected by it without having agreed to its terms.
- Allocative Efficiency
- The output level where society produces the mix of goods it values most, reached when Marginal Social Benefit equals Marginal Social Cost (MSB = MSC).
- Deadweight Loss
- The welfare society loses because the wrong quantity is produced. These are the units where the extra cost to society is greater than the extra benefit, or beneficial units that are not produced.
- Marginal Private Cost (MPC)
- The direct out-of-pocket cost a producer pays to make one extra unit of output.
- Marginal Social Cost (MSC)
- The total cost to society of producing one additional unit, equal to private cost plus marginal external cost (MSC = MPC + MEC).
- Marginal Private Benefit (MPB)
- The direct satisfaction or utility an individual gets from consuming one more unit of a product.
- Marginal Social Benefit (MSB)
- The total benefit to society from one extra unit consumed, calculated as MPB + MEB for positive externalities, or MPB - MEC when consumption harms others.
- Public Good
- A good that is non-excludable (non-payers cannot be shut out) and non-rival (one person's use does not reduce availability for others).
- Free-Rider Problem
- A breakdown where people consume non-excludable goods without contributing to their cost, removing any incentive for private firms to supply them.
- Demerit Good
- A product that harms third parties and whose personal health or financial risks are discounted by consumers, leading to free-market overconsumption.
- Merit Good
- A product that delivers positive spillovers and whose long-term individual benefits are undervalued by consumers, leading to free-market underconsumption.
- Asymmetric Information
- A market imbalance where one party in an exchange holds better or more complete information than the other.
- Adverse Selection
- An information failure where higher-risk buyers buy insurance in greater numbers, pushing up average claims and threatening market viability.
- Herfindahl-Hirschman Index (HHI)
- A measure of market concentration calculated by summing the squared percentage market shares of all firms. Higher values mean greater concentration. Under the historical 2010 US bands used in these practice examples, a score above 2,500 is classified as highly concentrated.
- Factor Immobility
- The practical friction that stops labour or capital moving freely between industries, regions, or occupations.
- Government Failure
- When state intervention creates net welfare losses or misallocates resources more severely than the uncorrected free market.
Check yourself
What two non-negotiable qualities define a pure public good?
Non-excludability (you cannot stop non-payers from using it) and non-rivalry (one person's use does not diminish what is left for others).
Why does the Irish Government impose high excise taxes on cigarettes?
Cigarettes are demerit goods whose retail price ignores heavy external health costs, leading to overconsumption. Taxation lifts retail prices to contract demand toward the socially optimal output while raising revenue for public healthcare.
In a negative production externality diagram, where does the deadweight loss triangle point?
The apex of the triangle points left to the socially optimal output Q* (where MSC = MSB), with its wide base sitting at the free-market output Q_M.
Calculate the HHI for an industry with market shares of 50%, 25%, 15%, and 10%, and classify the market using the practice threshold of above 2,500 for high concentration.
HHI = 50² + 25² + 15² + 10² = 2,500 + 625 + 225 + 100 = 3,450. Because 3,450 is higher than 2,500, the market is classified as highly concentrated.
How do community rating and Lifetime Community Rating work together to limit adverse selection?
Community rating generally gives people the same base premium for the same plan regardless of health or age, with permitted discounts such as child and young-adult rates and separate Lifetime Community Rating loadings. This helps prevent people being priced out because of their health risk. On its own this could let younger, healthier people delay buying cover. Lifetime Community Rating adds a loading for people who first buy cover later in life, which encourages low-risk people to join and keeps the risk pool balanced.
Using a cost-benefit approach, what is a key distributional drawback of environmental taxes like the carbon tax?
They are regressive; lower-income families spend a larger percentage of their disposable income on home heating and essential transport fuels than higher-income families.