

Economics studies how people, firms and governments make choices when resources are scarce. In this topic, you learn how economists think: how they use models and data, how they separate facts from opinions, how they weigh up trade-offs through opportunity cost and cost-benefit analysis, and how major crises such as the Great Depression and the 2008 crash reshaped modern economic policy.
Scarcity, Choice and Economic Agents
Human wants are unlimited, but the resources available to satisfy them are strictly limited. This permanent imbalance creates scarcity. Because society cannot produce everything people desire, we must make choices about what goods and services to produce, how to produce them, and who receives them.
Economists group all productive resources into the four factors of production, each earning a specific factor payment:
- Land: All natural resources and physical space, such as farmland, mineral deposits, rivers, and building sites. Its factor payment is rent.
- Labour: The human physical and mental effort used in production. Its factor payment is wages.
- Capital: Man-made physical equipment used to produce other goods and services, such as factory machinery, computers, and delivery vans. Its factor payment is interest.
- Enterprise: The initiative taken by an entrepreneur to combine land, labour, and capital while carrying the financial risk of business failure. Its factor payment is profit.
How Economic Agents Interact
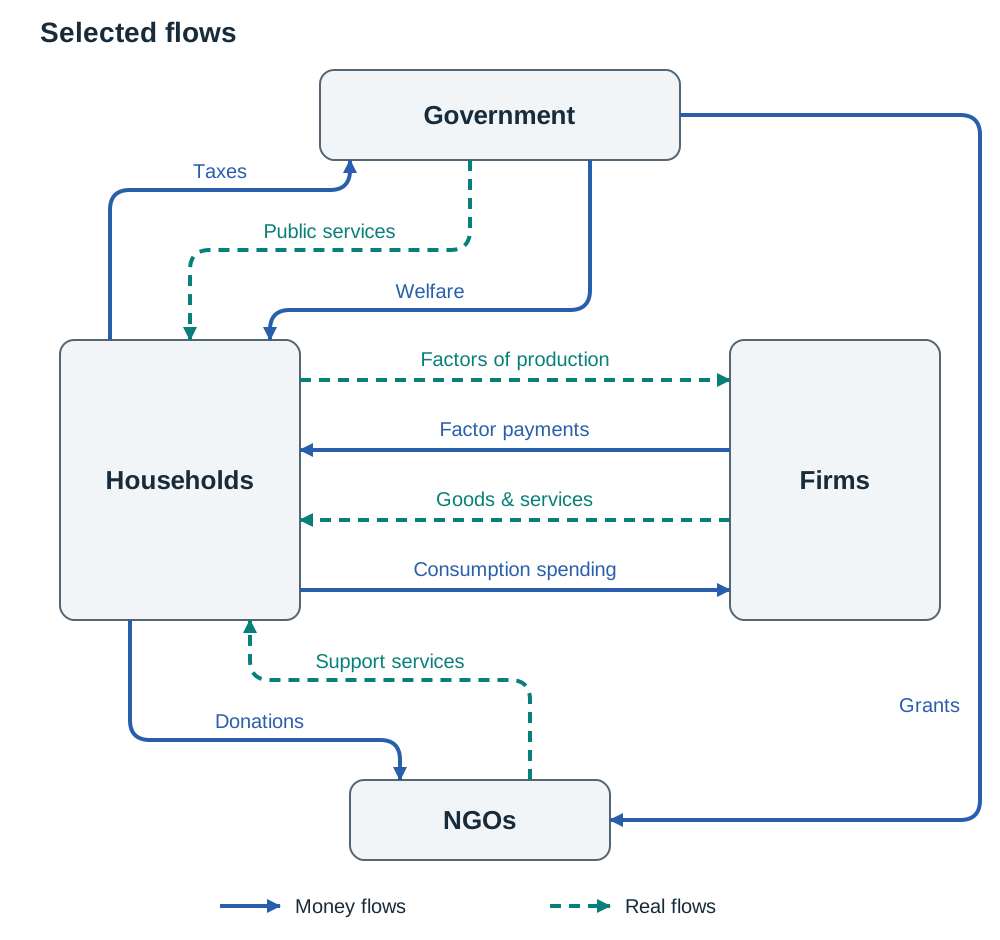
An economy relies on four main economic agents who interact within the circular flow of income:
- Individuals (households): Supply factors of production (especially labour) to businesses and receive factor payments (such as wages). They spend this income on goods and services.
- Firms: Hire factors of production from households to manufacture products and supply services, earning sales revenue in return.
- The government: Withdraws money from the flow by collecting taxes (such as PAYE and VAT) and injects money back into the flow through public services, infrastructure projects, public sector wages, and social welfare transfers.
- Non-governmental organisations (NGOs): Charities and non-profit groups that fund services using donations and state grants. In Ireland, NGOs often provide vital supports that markets overlook, such as homeless shelters and emergency food provision.
For example, an engineer in a Galway medical device firm earns wages, pays income tax, and spends the rest in local shops. The Irish government uses her tax to help fund a regional hospital, which in turn pays doctors and nurses who spend their incomes back in the wider economy.
Opportunity Cost and the Production Possibility Frontier
Because resources are scarce, choosing one option always means giving up another. We measure this sacrifice through opportunity cost: the cost of an economic decision measured in terms of the value of the next best alternative forgone.
- Individuals: A student with €60 chooses between a concert ticket and a pair of runners. If she buys the ticket, the opportunity cost is the runners—the single next best alternative forgone, not the money itself.
- Firms: A distillery in Cork using its warehouse space to mature whiskey sacrifices the profit it could have earned storing gin.
- Governments: If the government spends €1.5 billion on new hospital wings, that money cannot fund its next best alternative, such as the MetroLink rail project. The opportunity cost is MetroLink.
Evaluating opportunity cost means judging whether the chosen option delivers more social or private value than what was given up. Every choice also has wider consequences. For instance, allocating €1 billion to build social housing rather than cutting income tax creates construction jobs and increases the housing supply over time, but leaves workers with less take-home pay in the short run to spend in local shops.
The Production Possibility Frontier (PPF)
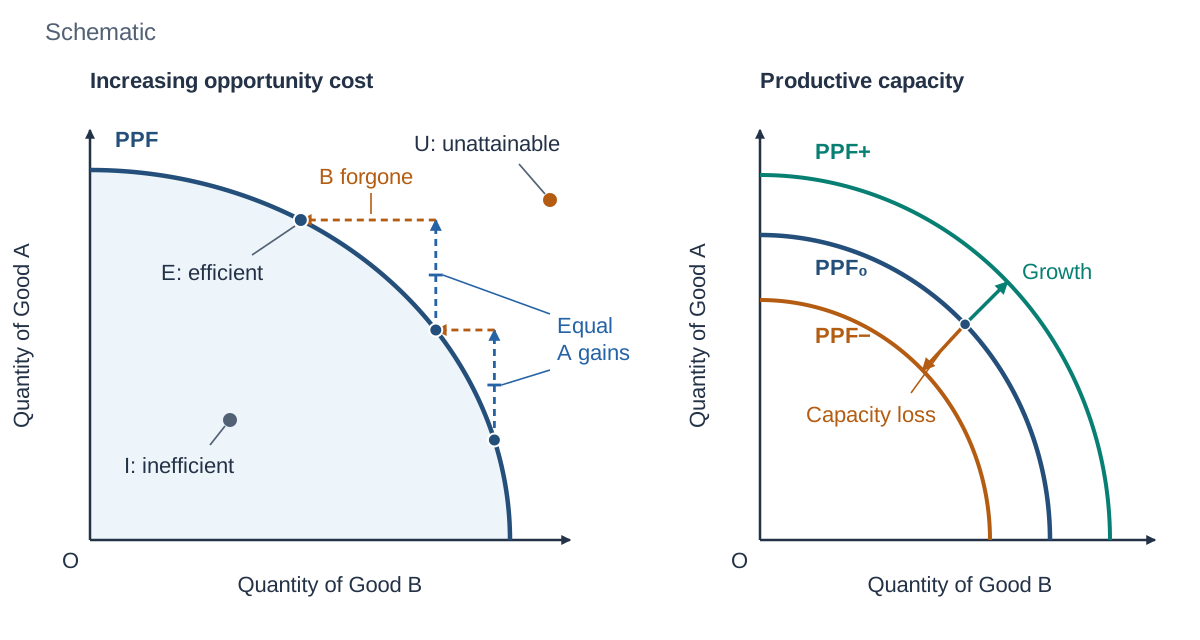
The Production Possibility Frontier (PPF) is a curve showing the maximum combinations of two goods or services an economy can produce when fully and efficiently using all its available resources and current technology.
In a standard exam diagram:
- The vertical axis shows the quantity of Good A; the horizontal axis shows Good B.
- The curve is usually drawn bowed outwards (concave to the origin). This illustrates the law of increasing opportunity cost: as an economy produces more of Good A, it must sacrifice progressively larger amounts of Good B. This happens because productive resources are not equally suited to every task—a software engineer cannot become an agricultural shearer overnight without a sharp drop in productivity.
- A straight-line PPF is correct only if opportunity cost is constant, meaning resources are completely interchangeable between both goods.
Analysing PPF Positions and Shifts
- Points on the curve: Represent productive efficiency. All resources are fully employed without waste.
- Points inside the curve: Represent productive inefficiency or underemployed resources (such as high unemployment or idle factories). Output of both goods can increase simply by putting existing resources to work.
- Points outside the curve: Are currently unattainable given existing resources and technology, showing the direct constraint of scarcity.
- Shifts in the frontier: An outward shift of the entire curve represents economic growth, caused by technological progress, capital investment, or an expanded workforce. An inward shift shows a loss of productive capacity, such as widespread infrastructure damage or severe outward emigration.
Incentives, Specialisation and Decision-Making
An incentive is any financial or non-financial reward or penalty that motivates or deters economic behaviour.
- Positive incentives: Subsidies for home insulation, tax credits for research and development (R&D), and overtime wage rates encourage desired actions.
- Negative incentives (disincentives): Plastic bag levies, fuel excise duties, and landfill charges penalise socially damaging habits.
Policies frequently trigger conflicting incentives across different groups:
- Local: A city-centre congestion charge encourages commuters onto public transport and reduces smog, but it raises travel costs for suburban workers and reduces footfall for city retailers.
- National: Ireland's carbon tax creates an incentive to install heat pumps, but it places a heavy financial burden on rural households who have no access to public transport or district heating.
- International: EU agricultural emissions targets aim to limit climate change, but they conflict with the commercial incentives of Irish dairy and beef farmers who want to maximise output and export revenue.
Specialisation and the Division of Labour
Specialisation occurs when individuals, businesses, or entire economies concentrate their productive efforts on a specific task or narrow range of goods.
Within a firm, specialisation takes the form of the division of labour, where production is split into separate tasks carried out by different workers. As Adam Smith observed in his classic pin factory example, division of labour boosts efficiency because:
- Workers become faster and more skilled through continuous repetition.
- Workers waste no time switching between tools and workstations.
- Firms can match employees to the tasks best suited to their individual skills.
- It makes the introduction of specialised machinery practical.
For an individual, specialisation means focusing on a specific trade. A self-employed electrician concentrates on wiring installations and hires an accountant to manage her tax returns, because her time earns far more in electrical work than in bookkeeping.
Specialisation carries risks. Repetitive work can cause boredom and demotivation, and workers with very narrow skills face structural unemployment if their industry declines. At a national level, Ireland specialises heavily in foreign-owned pharmaceuticals, medical devices, and computer services. This brings high wages and corporate tax receipts, but leaves the domestic economy exposed to external global shocks or changes in international corporate tax rules.
Economic Methodology: Models, Data and Statements
Economics is a social science. Because economists cannot run experiments inside a sealed laboratory, they build theoretical models—such as supply and demand diagrams—to isolate cause and effect. To make these models workable, economists rely on the assumption of ceteris paribus ('all other things being equal'). This means they examine the impact of one changing variable while assuming every other factor remains unchanged.
Economists classify economic statements into two groups:
| Feature | Positive Economic Statement | Normative Economic Statement |
|---|---|---|
| Core Meaning | Objective statement about what is, was, or will be | Subjective value judgement about what ought to be |
| Testing | Can be tested, verified, or refuted using real-world data | Cannot be proven true or false using data alone |
| Signal Words | 'Is', 'was', 'will increase', 'leads to' | 'Should', 'ought to', 'fair', 'unfair', 'better' |
| Irish Example | 'The CSO reported that the consumer price index rose by 2.2% over the year.' | 'The government should cap energy prices to protect vulnerable families.' |
A positive statement does not have to be true; it simply has to be testable. 'Ireland's unemployment rate is currently 25%' is entirely false, but it is still a positive statement because official Central Statistics Office (CSO) data can refute it.
Predictions can also be positive. For example, 'Increasing the national minimum wage will lead to the loss of 5,000 retail jobs' sounds like a heated political claim, but it is a positive statement because researchers can test the prediction against employment data over time.
Working with Economic Data
Economists use empirical data (information collected from the real world) from agencies like the CSO, the Central Bank of Ireland, Eurostat, and the OECD to evaluate policies. When analyzing data in an exam, follow four steps:
- Identify the general trend (rising, falling, or stable).
- Quote the figures accurately, including dates and units.
- Offer an economic reason for the movement.
- Point out a limitation of the data (such as time lags, revisions, or national averages masking regional variations).
To calculate the percentage change between two figures:
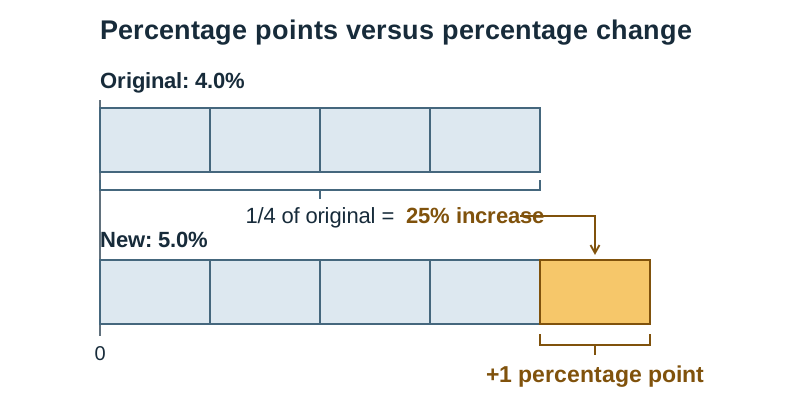
Be careful to distinguish between a change in percentage points and a percentage change. If an interest rate moves from 4.0% to 5.0%, it has increased by 1.0 percentage point, but the percentage increase in the rate is 25%:
Microeconomics vs Macroeconomics and Cost-Benefit Analysis
Microeconomics studies individual decision-makers and single markets. It looks at how prices are set in specific sectors (such as residential rents in Dublin or retail milk pricing) and how consumers allocate their spending.
Macroeconomics examines the economy as an aggregate whole. It focuses on national indicators such as inflation, overall employment, and economic growth. Economists track total spending through Aggregate Demand (AD) and total output through Aggregate Supply (AS), measuring national output using figures like GDP or modified Gross National Income (GNI\*, a CSO indicator that removes multinational accounting distortions to reveal the underlying size of the domestic Irish economy).
- Micro question: Why did the price of petrol at Irish filling stations rise this month?
- Macro question: Why did the general price level across Ireland rise this year?
Cost-Benefit Analysis (CBA)
Private firms greenlight investments if they forecast commercial profits. Governments use Cost-Benefit Analysis (CBA), a systematic framework that weighs the total social costs of a public project against its total social benefits to decide whether it improves social welfare.
- Private costs: Direct financial spending on construction, materials, and wages.
- External costs: Negative third-party externalities forced on wider society, such as traffic congestion, noise, and airborne dust during building works.
- Private benefits: Direct revenue earned from the project, like passenger ticket fares.
- External benefits: Positive third-party spillovers enjoyed by society, like shorter travel times, fewer road collisions, and lower carbon emissions.
Because many benefits arrive years after the money is spent, economists give future costs and benefits a slightly lower value than money today. A project is deemed economically viable only if total social benefits exceed total social costs.
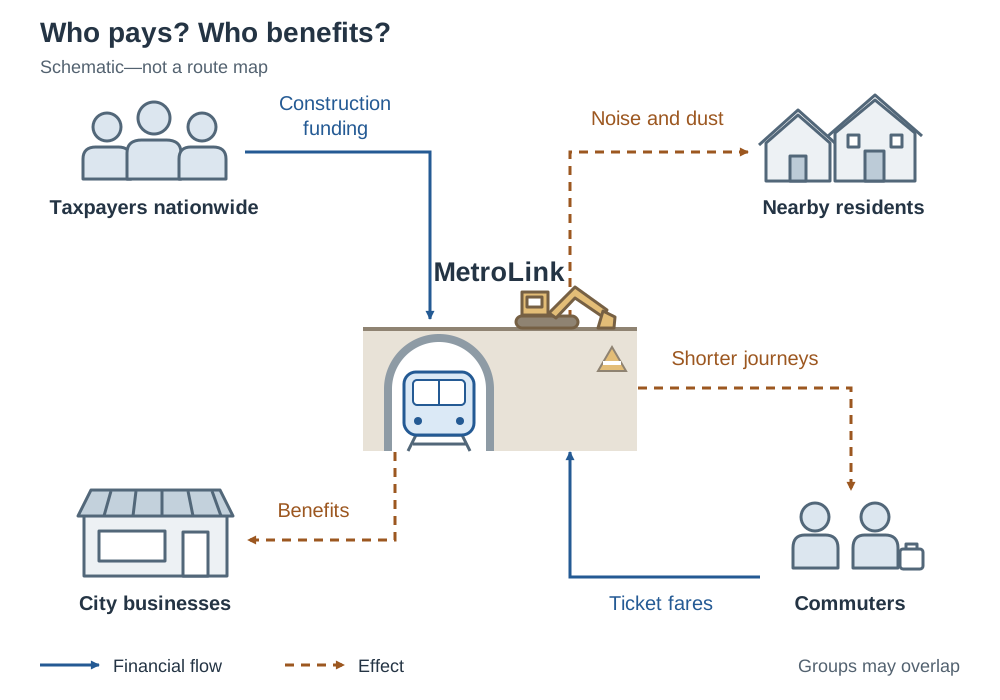
Examiners frequently assess distributional equity: Who enjoys the benefits, and who bears the costs? On major public builds such as Dublin's planned MetroLink, the benefits are concentrated among daily commuters and city businesses. Meanwhile, the disruption falls heavily on local residents living along the tunnelling route, and the multi-billion euro capital cost is paid by taxpayers nationwide, many of whom live in rural areas and will rarely use the line.
Differing Perspectives and Historical Crises
Economists frequently disagree on policy solutions because of:
- Different value judgements: One economist may prioritise reducing income inequality (a normative goal), while another prioritises business competitiveness and economic growth.
- Different models and assumptions: Classical economics assumes markets clear and adjust naturally via flexible prices and wages, favouring limited government intervention (laissez-faire). Keynesian economics argues that aggregate demand drives economic output and that wages and prices can remain stuck during downturns, leaving economies trapped in prolonged slumps without government spending.
- Different time horizons: Borrowing money to build infrastructure stimulates jobs in the short run, but risks adding to the national debt burden over the long run.
- Data interpretation: Statistics are frequently revised, and economists place differing weights on early indicators.
How Historical Crises Reshaped Policy
- The Great Depression (1929–1939): A catastrophic slump where US unemployment reached roughly 25% in 1933. The depth and length of the slump led John Maynard Keynes, in The General Theory (1936), to argue that markets might not restore full employment on their own, so governments should manage aggregate demand, for example by increasing spending and running deficits in a recession. After 1945, demand management became the standard Western economic tool.
- The Irish Economic Crises of the 1950s: From the 1930s, Ireland imposed high import tariffs to protect domestic manufacturers. By the 1950s, this insular policy caused industrial stagnation and severe balance of payments crises (in 1951 and 1955–56), as import spending outstripped export receipts. Governments initially responded with deflationary budgets—raising taxes, cutting public spending, and slapping levies on imports in 1956. Squeezing domestic demand backfired: it deepened the slump, causing job losses and forcing net emigration above 400,000 between 1951 and 1961.
- The policy shift: Recognising that protectionism had failed, civil servant T.K. Whitaker published his study Economic Development (1958), which formed the core of the government's First Programme for Economic Expansion (1958). Building on export profits tax relief introduced in 1956, Ireland shifted toward outward-looking trade and courting foreign direct investment. Tariffs were dismantled gradually through the Anglo-Irish Free Trade Agreement (1965) and Ireland's entry into the European Economic Community (EEC) in 1973.
- The Great Recession (from 2007): Triggered internationally by the US subprime mortgage crash, this crisis struck Ireland with extreme force due to a domestic property bubble, reckless bank lending, and light-touch regulation. When property values collapsed, domestic banks faced insolvency.
- Policy responses: The Irish government issued a blanket bank guarantee in September 2008 and created the National Asset Management Agency (NAMA) in 2009 to absorb bad property loans. Collapsing tax revenues led to severe austerity budgets between 2008 and 2014, involving spending cuts and tax hikes to narrow a massive exchequer deficit. In November 2010, locked out of private bond markets, Ireland entered a €67.5 billion EU-IMF bailout programme, which concluded in December 2013. At the European level, the European Central Bank (ECB) cut its main interest rate to 0% and launched quantitative easing (buying government bonds) to inject liquidity.
- Lasting reforms: The crash prompted the creation of the Irish Fiscal Advisory Council in 2011 to independently assess budgetary policy, the introduction of strict Central Bank of Ireland mortgage lending limits in 2015, and the establishment of ECB banking union supervision in 2014.
Key terms
- Scarcity
- The fundamental economic condition where limited productive resources cannot satisfy unlimited human wants.
- Factors of Production
- The four economic resources used to make goods and services: land (earning rent), labour (earning wages), capital (earning interest), and enterprise (earning profit).
- Opportunity Cost
- The cost of an economic choice measured in terms of the value of the next best alternative forgone.
- Production Possibility Frontier (PPF)
- A curve showing the maximum combinations of two goods or services an economy can produce when fully and efficiently using all available resources and technology.
- Ceteris Paribus
- A Latin phrase meaning 'all other things being equal', used in models to isolate the effect of a single variable.
- Positive Economic Statement
- An objective, testable statement about what is, was, or will be, which can be verified or refuted against empirical data.
- Normative Economic Statement
- A subjective value judgement expressing what ought to be, which cannot be proven or disproven using data alone.
- Incentive
- A financial or non-financial motivator or deterrent that influences the choices and actions of economic agents.
- Division of Labour
- The breaking down of a production process into separate, sequential tasks, with each worker specialising in a single task to increase efficiency.
- Cost-Benefit Analysis (CBA)
- A systematic decision-making appraisal that calculates and compares the total social costs and total social benefits of a project.
- Social Cost
- The overall cost of an economic action to society as a whole, equal to private costs plus external costs.
- Social Benefit
- The overall benefit of an economic action to society as a whole, equal to private benefits plus external benefits.
- Keynesian Economics
- An economic school of thought holding that aggregate demand drives economic output and that governments should intervene through spending and borrowing during recessions.
- Laissez-faire
- The principle that governments should minimise intervention in the operation of free markets.
Check yourself
State the four economic factors of production and the factor payment earned by each.
Land earns rent, Labour earns wages, Capital earns interest, and Enterprise earns profit.
A farmer decides to sow a field with barley instead of grazing cattle. What is the opportunity cost of this choice?
The opportunity cost is the income or output sacrificed from grazing cattle, which was the next best alternative use of the land.
Why is a Production Possibility Frontier typically drawn bowed outwards (concave to the origin)?
Because of the law of increasing opportunity cost: productive resources are not equally adaptable to producing different goods, so progressively more of one good must be sacrificed to produce each additional unit of the other.
Classify the following statement as positive or normative and justify your answer: 'The government ought to abolish the universal social charge.'
It is a normative statement because it contains the prescriptive word 'ought to' and represents a subjective value judgement that cannot be tested or verified using empirical data.
How do deflationary budgets in the 1950s help explain why Irish economic policy changed direction in 1958?
Cutting spending, raising taxes and imposing import levies (1956) reduced imports but also cut output and jobs, adding to unemployment and emigration (net emigration exceeded 400,000 in 1951–61). This showed that squeezing demand in a small, protected economy deepened the slump, which helped push policy towards the 1958 outward-looking, export-led strategy.
If the national unemployment rate falls from 5.0% to 4.5%, what is the fall in percentage points and what is the percentage change?
It is a fall of 0.5 percentage points (5.0 - 4.5), and a 10% fall in the rate: ((4.5 - 5.0) / 5.0) * 100 = -10%.