

Topical questions and statistics test your ability to think like an economist by evaluating contemporary events, manipulating quantitative data, and assessing economic policy. At Leaving Certificate Higher Level, you are expected to analyse real-world Irish and international issues, distinguish positive analysis from normative judgements, interpret modified macroeconomic indicators such as GNI*, and calculate the impact of fiscal injections or withdrawals using open-economy multiplier formulas. These analytical, data-processing, and evaluative skills are tested across Section A and Section B of the written examination (worth 80% of total marks) and in the annual SEC Research Study (worth 20%).
Economic Inquiry: Positive versus Normative Analysis
Economics is a social science driven by inquiry into how individuals, firms, and governments allocate scarce resources. In topical analysis and commentary, you must distinguish between objective facts and subjective recommendations.
- Positive statements describe what is, was, or will be. They are objective, testable propositions that can be verified or refuted against empirical evidence. For example: "Ireland's harmonised unemployment rate stood at 4.2% in late 2024." Even if an empirical claim is factually false (such as claiming unemployment was 15%), it remains a positive statement because evidence can test and refute it.
- Normative statements express value judgements or ethical assertions about what ought to be or should be. They cannot be settled by data alone because they reflect political priorities or morals. For example: "The Irish government ought to raise tax rates on high earners to fund public healthcare."
Economists frequently agree on the positive analysis—such as agreeing that rent caps reduce the quantity of private rental housing supplied—while disagreeing on the normative policy conclusion. Historical turning points such as the Great Depression of the 1930s, the Irish stagnation of the 1950s, and the Great Recession from 2007 reshaped policy perspectives because positive data exposed the flaws of existing economic models, forcing policy thinking to change over time.
Measuring Irish Output: GDP, GNP, GNI, GNDI, and Modified GNI (GNI*)
Headline output figures for Ireland can give a deeply misleading picture of domestic living standards because of multinational corporate activity. You must understand the full chain of national income measures.
- Gross Domestic Product (GDP) measures the total monetary value of all final goods and services produced within the geographical boundaries of a country over a year.
- Gross National Product (GNP) adjusts GDP by adding Net Factor Income from the Rest of the World (NFIWR). In Ireland, NFIWR is heavily negative because multinational corporations (MNCs) repatriate large operating profits to their parent countries overseas:
- Gross National Income (GNI) measures the total income earned by permanent residents of a country, regardless of where that income was earned. In the Irish accounts, it is GNP adjusted for net transactions with the European Union:
- Gross National Disposable Income (GNDI) measures the income actually available to Irish residents to spend or save by adding net current transfers from abroad (such as EU transfers and remittances):
- Modified Gross National Income (GNI)**: In 2015, measured Irish GDP grew by roughly 25% in a single year (the figure has since been revised by the CSO), which the economist Paul Krugman nicknamed 'leprechaun economics', because the jump reflected multinational balance-sheet changes rather than real activity in Ireland. Technology and pharmaceutical firms relocated foreign intellectual property onto Irish balance sheets, engaged in contract manufacturing abroad, and booked aircraft leasing assets here.
To strip out these multinational distortions, the Central Statistics Office (CSO) developed Modified GNI ():
For evaluating Irish living standards and debt sustainability, rank ahead of , ahead of , and ahead of . Each step removes output that does not accrue to Irish residents. For example, if Ireland's national debt is €220bn, GDP is €500bn, and is €280bn, then the Debt-to-GDP ratio is 44%, but the Debt-to- ratio is 79%. The Irish Fiscal Advisory Council (IFAC) and the Department of Finance use Debt-to- because domestic tax revenues service the national debt, not multinational balance-sheet transactions.
Statistical Manipulation: Percentages, Percentage Points, and the CPI
Topical questions frequently require you to manipulate data tables. You must show the algebraic formula, intermediate substitution, and correct units.
Percentage Change versus Percentage Points
A percentage point is the simple arithmetic difference between two percentage figures, whereas a percentage change measures relative growth compared to the initial level.
If an unemployment rate falls from 6.0% to 4.0%, it has fallen by 2.0 percentage points. In contrast, the relative percentage decrease in the unemployment rate is:
Confusing these two concepts is heavily penalised in Leaving Certificate examinations.
How the Consumer Price Index (CPI) is Constructed
The CSO measures changes in the cost of living using the Consumer Price Index:
- A representative basket of goods and services typically bought by an average household is selected.
- Each item is assigned a weight reflecting its proportion of total household spending (for instance, housing and fuel carry heavier weights than cinema tickets).
- Prices are tracked monthly across Ireland and compared to a base period set to 100.
- The annual inflation rate is the percentage change in the index over twelve months.
The Harmonised Index of Consumer Prices (HICP) is compiled across all EU member states using an identical methodology so inflation can be compared internationally. The European Central Bank (ECB) targets an HICP inflation rate of 2% over the medium term for the euro area. The Irish CPI and HICP differ slightly in coverage (such as the inclusion of mortgage interest in the domestic CPI).
When calculating inflation between two non-base years, you cannot simply subtract the index points. For example, if the CPI rises from 107.8 in Year 1 to 114.5 in Year 2:
Saying that inflation was 6.7% loses marks: 6.7 is the change in index points, not a percentage. The 6.7 must be expressed as a percentage of the Year 1 index (107.8), because that is the price level the rise is measured from.
Price Stability, Living Standards, and Labour Market Metrics
Exam questions often test the link between price stability, household welfare, and labour market performance.
Nominal versus Real Values
Nominal figures measure value at current market prices, while real figures adjust for inflation:
Always use this formula in calculation questions. The shortcut (Real Growth Nominal Growth Inflation) is only an approximation for small changes and should be used only as a sense-check.
Disinflation versus Deflation
Disinflation is a decrease in the rate of inflation (for example, falling from 8% down to 3%). Prices are still rising, just at a slower rate. Deflation occurs only when the inflation rate turns negative, meaning the general price level is falling.
Measuring Employment and Unemployment
The labour force includes all persons aged 15 and over who are either in employment or unemployed:
- A person is defined as unemployed under the CSO's Labour Force Survey (LFS) and International Labour Organization (ILO) criteria if they are without work, available for work, and have actively sought work in the past four weeks.
- The Live Register is an administrative count of people signing on for jobseeker's benefits or credits. It is not an accurate measure of unemployment because it includes casual and part-time workers and excludes unemployed individuals who do not qualify for state payments.
Economically inactive individuals (such as full-time students, retired persons, and home carers) are excluded from the labour force. Consequently, an unemployment rate can fall because people found jobs, or because discouraged jobseekers gave up searching and left the labour force entirely.
The Multiplier and Macroeconomic Policy Evaluation
The multiplier effect () shows how an initial change in spending injections () generates a larger cumulative change in national income ().
When money is injected into the circular flow, it becomes income for households. Part of this income is spent on domestic consumption, while the rest leaks out through withdrawals:
- Marginal Propensity to Save (MPS): the fraction of additional disposable income saved.
- Marginal Propensity to Tax (MPT): the fraction paid in taxation.
- Marginal Propensity to Import (MPM): the fraction spent on foreign goods and services.
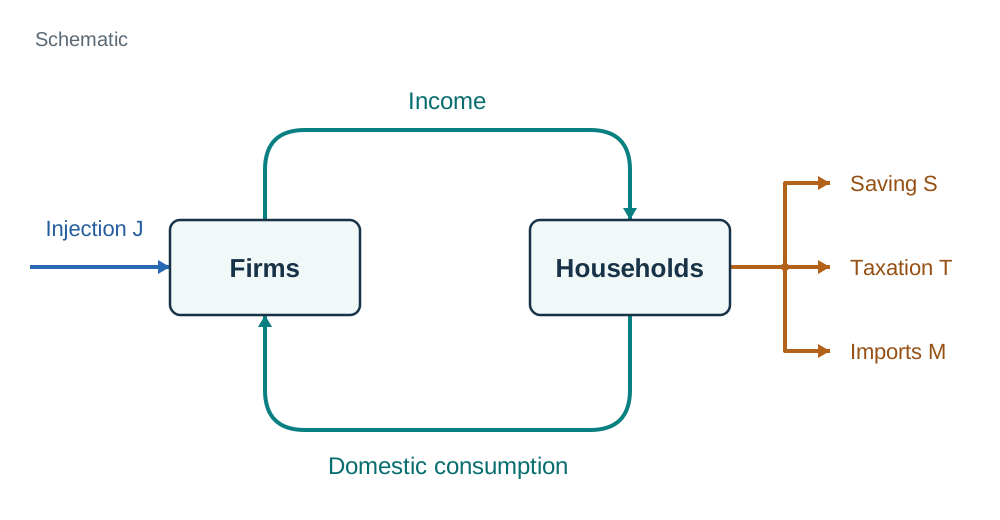
The rule for exam calculations is:
If a question supplies MPC and MPM only, then , where . If MPT is also provided, include it in the denominator. Never invent a leakage the prompt has omitted.
Income Gap versus Required Injection
Two figures are involved, and you should always present both, clearly labelled:
- The income gap is the shortfall in equilibrium national income: .
- The required injection is the initial spending change that, once multiplied, closes that gap: .
Some sources use the term deflationary gap for the income shortfall itself, while others use it for the required initial injection. In an exam, state both figures explicitly and label your working to secure full marks.
When current income is above full-employment capacity, an inflationary gap exists. Real output cannot expand further, so excess demand drives up prices. To remove this gap, the government applies contractionary fiscal policy, reducing injections or increasing taxes by .
Assumptions and Limitations of the Multiplier
When evaluating multiplier policies, state these key assumptions:
- The marginal propensities (MPS, MPT, MPM) remain constant.
- There is spare capacity (unemployed resources) in the economy so that injections increase real output rather than merely pushing up prices.
- Government borrowing does not cause crowding out of private investment.
- Time lags are ignored (in reality, spending rounds take several years).
In Ireland, because we are a small open economy with a high MPM, a large portion of any domestic stimulus leaks abroad into imports, giving Ireland a relatively low multiplier.
Business Cycles, Indicators, and Data Limitations
Strand 4 requires you to track business cycles and critique statistical evidence.
The Four Phases of the Business Cycle
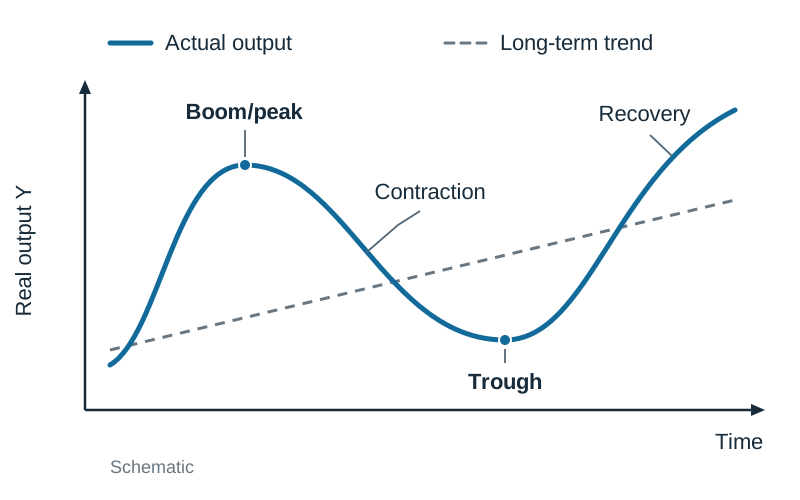
A business cycle describes fluctuations in economic output around its long-term growth trend:
- Boom (peak): Output is at or above sustainable potential; unemployment is low, consumer confidence is buoyant, and tax receipts are high.
- Contraction (recession): Output falls and investment drops. A technical recession is defined as two consecutive quarters of negative real GDP growth.
- Trough (slump): Economic activity reaches its lowest point; spare capacity and unemployment are at their peak.
- Recovery (expansion): Output, employment, and business investment begin to expand again.
Remember that unemployment is a lagging indicator: it continues to rise even after output begins to recover, as businesses restore hours to existing staff before hiring new workers.
Indicators of Growth, Inequality, and Sustainability
Have these specific metrics ready for evaluation questions:
- Economic growth: Annual percentage change in real GDP, real GNP, or real ; per capita.
- Inequality: The Gini coefficient (ranging from 0 for total equality to 1 or 100 for total inequality). A rising Gini indicates widening inequality. Other metrics include the at-risk-of-poverty rate (income below 60% of national median income) and the deprivation rate.
- Social cohesion: The Inequality-adjusted Human Development Index (IHDI), which discounts national achievements in health, education, and income by the degree of inequality present across the population.
- Environmental sustainability: Total greenhouse gas emissions, emissions per unit of output (emissions intensity), and the proportion of electricity produced from renewables. Note that emissions intensity can fall while total national emissions continue to rise if economic output expands faster than efficiency improves.
Critical Evaluation of Data
When interpreting statistics in Section B, apply these checks:
- Correlation versus causation: Two data series moving together does not prove one caused the other. Always write that the trend is consistent with an economic theory, not that it proves it.
- Seasonal adjustment: The CSO presents labour market statistics on a seasonally adjusted basis to strip out predictable annual cycles, such as summer leavers or holiday retail hiring.
- Provisional versus revised data: Initial national accounts figures are preliminary and subject to subsequent revisions by statistical agencies.
- Stock versus flow: A stock is measured at a specific date (such as Ireland's national debt of €220bn), whereas a flow is measured over a period of time (such as an annual budget deficit of €4bn). A smaller budget deficit means the state is borrowing less this year, not that total national debt has fallen.
Structuring Exam Answers and the SEC Research Study
Topical questions in the Leaving Certificate reward clear structure and evidence-based reasoning.
The SEE Principle for Exam Writing
Structure each analytical point using the SEE method:
- State: Provide a clear topic sentence that defines the concept or answers the question directly.
- Explain: Walk through the economic mechanism step by step. Explicitly state assumptions (such as ceteris paribus or spare capacity).
- Example / Evidence: Quote dated Irish or European economic data (such as the establishment of the Future Ireland Fund in 2024 to manage corporation tax receipts, or ECB rate decisions).
Five-Step Routine for Data-Response Questions
- Overall trend: State the broad direction over the full timeframe.
- Key changes: Highlight periods of significant growth or contraction.
- Turning points: Pinpoint exact years where peaks or troughs occurred.
- Economic mechanism: Explain the cause using economic theory.
- Divergences and limitations: Note conflicting variables or data limitations.
The SEC Research Study (20%)
Completed in sixth year, the research study is based on an annual brief issued by the State Examinations Commission. To achieve the top band, your report must demonstrate:
- A clear, focused economic inquiry question chosen from the SEC brief.
- Relevant, reliable data gathered from multiple sources (such as the CSO, Eurostat, Central Bank of Ireland, or OECD), citing sources and dates.
- Accurate application of economic models and concepts (e.g. elasticity, the circular flow, GNI*).
- Correct mathematical manipulation of data presented in your own tables or charts.
- Evidence-based conclusions alongside personal reflection on how the inquiry influenced your attitudes, perspectives, or behaviour. All work must follow SEC authentication protocols regarding original authorship and internet usage.
Key terms
- Positive Statement
- An objective, testable statement concerning economic facts and relationships that can be validated or refuted using empirical evidence, containing no value judgements.
- Normative Statement
- A subjective value judgement or policy recommendation concerning what ought to happen, which cannot be proved or disproved solely by data.
- Modified GNI (GNI*)
- An Irish macroeconomic metric developed by the CSO that strips out the distorting effects of depreciation on foreign intellectual property, depreciation on leased aircraft, and net factor income of redomiciled PLCs.
- Percentage Point
- The simple arithmetic difference between two percentage values (such as an interest rate changing from 3% to 5%, which is a rise of 2 percentage points).
- Disinflation
- A reduction in the rate of inflation over time, meaning the general price level continues to rise, but at a slower pace.
- Labour Force
- All persons aged 15 and over who are either in employment or unemployed according to International Labour Organization criteria (available for and actively seeking work).
- The Multiplier (k)
- The ratio by which a change in autonomous spending injections leads to a larger final change in equilibrium national income.
- Stock and Flow
- A stock is an economic quantity measured at a specific point in time (such as national debt), whereas a flow is measured over a defined duration (such as an annual budget deficit).
- Gini Coefficient
- A statistical measure of income or wealth inequality within a population, ranging from 0 (perfect equality) to 1 (complete inequality).
- Lagging Indicator
- An economic metric, such as the unemployment rate, that alters only after the broader economy has already initiated a cyclical expansion or contraction.
- Recession
- A period of temporary economic decline, formally identified by two consecutive quarters of negative real GDP growth.
- Inequality-adjusted HDI (IHDI)
- A United Nations metric assessing average achievements in health, schooling, and income, discounted by the level of inequality across the population.
Check yourself
Identify whether the following statement is positive or normative: 'The government ought to introduce rent controls to protect private tenants.' Explain your answer.
It is a normative statement because it expresses a subjective value judgement about what policy should be implemented, which cannot be tested or verified solely by empirical data.
What three items are subtracted from GNI to calculate Modified GNI (GNI*) in Ireland?
The CSO subtracts: (1) depreciation on foreign-owned intellectual property, (2) depreciation on leased aircraft, and (3) the net factor income of redomiciled PLCs.
If an open economy has MPC = 0.75 and MPM = 0.15, and no tax rate is supplied, calculate the multiplier.
First calculate MPS = 1 - MPC = 1 - 0.75 = 0.25. The multiplier k = 1 / (MPS + MPM) = 1 / (0.25 + 0.15) = 1 / 0.40 = 2.5.
An economy operating above full employment has an actual income of €170bn and a full-employment income of €150bn. If k = 1.25, what fiscal action should the government take to eliminate the inflationary gap?
The income gap is €170bn - €150bn = €20bn. The required reduction in injections is €20bn / 1.25 = €16bn. The government should implement contractionary fiscal policy by reducing expenditure or increasing taxes by €16bn.
In Year 2, real GDP falls by 1.8% while the unemployment rate rises from 4.8% to 6.2%. Identify the phase of the business cycle.
The economy is in a contraction (or recession), characterized by negative output growth and rising unemployment.
Distinguish between a stock and a flow using Irish public finance examples.
A stock is an economic quantity measured at a specific date (e.g. Ireland's National Debt of €220bn), while a flow is measured over a period of time (e.g. an annual budget deficit of €4bn).