

Elasticity measures how responsive buyers and sellers are to changes in market conditions such as price or income. In Leaving Certificate Economics, Topic 2.2 centres on Price Elasticity of Demand (PED) and Income Elasticity of Demand (YED), while also connecting to Cross Price Elasticity of Demand (CED) and Price Elasticity of Supply (PES). At Higher Level, you should be able to calculate elasticity coefficients from data using a formula — two formulas are in common use, the percentage change method and the arc (midpoint) formula, so be comfortable with both — explain the precise economic meaning of the algebraic sign and numerical value, and evaluate how individuals, businesses, and the Irish government use elasticity to forecast revenue, design taxes, and allocate resources.
The Core Concept of Elasticity and Formulas
The Law of Demand states that when the price of a good rises, the quantity demanded falls, ceteris paribus (all other things being equal). But knowing the direction of the change is not enough. A business owner deciding whether to adjust prices needs to know how big the fall in sales will be.
Elasticity measures responsiveness by comparing percentage changes rather than absolute unit shifts. This allows economists to compare goods across completely different scales, such as a 20 cent increase on a litre of milk versus a €2,000 price rise on an electric car. Because one percentage change is divided by another, elasticity is just a number: it has no units, so never write '€' or 'units' after an elasticity figure.
Which Formula Should I Use?
State Examinations Commission (SEC) marking schemes accept two calculation approaches:
- The Percentage Change Method:
Use this method when the exam question gives you percentage changes directly or provides data across two separate calendar years.
- The Arc (Midpoint) Formula:
Where and (always calculated as new minus original to preserve correct mathematical signs). Use the arc (midpoint) formula whenever an exam question gives you two prices and two quantities.
Be aware that the two methods do not yield identical numerical figures from the same raw data. Always write down the formula before substituting, use that single formula throughout your answer, and never combine a percentage change on top with a raw level change underneath.
Price Elasticity of Demand (PED) and Demand Curves
Price Elasticity of Demand (PED) measures the responsiveness of the quantity demanded of a good to a change in its own price, ceteris paribus.
Because price and quantity move in opposite directions, PED is normally negative. In your exam answer, keep the negative sign in your working and final coefficient. When interpreting the coefficient, evaluate two separate elements:
- The negative sign (-): Proves that the good obeys the Law of Demand (an inverse relationship between price and quantity demanded).
- The absolute value (): Classifies the responsiveness of consumers.
Classifications of PED
- (Perfectly Inelastic): Quantity demanded does not change at all when price changes. Represented on a graph by a vertical demand curve.
- (Price Inelastic): The percentage change in quantity demanded is smaller than the percentage change in price ().
- (Unit Elastic): The percentage change in quantity demanded exactly equals the percentage change in price ().
- (Price Elastic): The percentage change in quantity demanded is larger than the percentage change in price ().
- (Perfectly Elastic): Consumers will buy all available output at the market price, but any price increase causes quantity demanded to drop to zero. Represented by a horizontal demand curve.
Interpreting Diagrams and Steepness
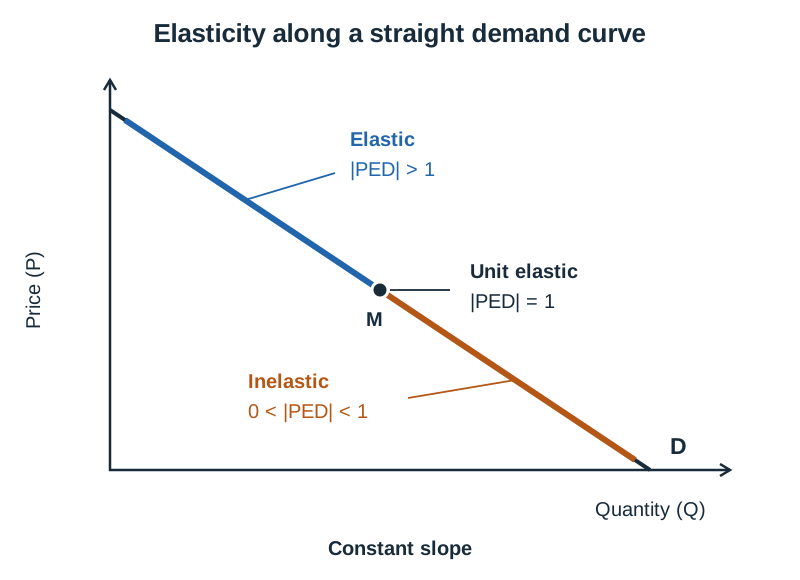
Be careful with steepness. Along a single straight-line demand curve, the slope remains constant, but elasticity changes at every point: demand is price elastic at high prices, unit elastic at the midpoint, and price inelastic at low prices. You cannot read elasticity off the slope of a single curve.
However, when comparing two different demand curves passing through the same point over the same price range, the flatter curve is the more price elastic curve, and the steeper curve is the more price inelastic curve.
Answering 'Is Demand Elastic or Inelastic? Explain'
When a question asks you to classify demand for a product (such as petrol above €2 per litre), use three sentences in this sequence:
- State the classification: 'Demand for petrol is price inelastic.'
- Give a determinant naming the good: 'Petrol is a necessity for daily commuters, with few close public transport substitutes in the short run.'
- State the percentage relationship: 'Therefore, the percentage fall in quantity demanded is smaller than the percentage rise in price ().'
Determinants of PED and the Total Revenue Rule
Whether demand for a product is elastic or inelastic depends on five core determinants:
- Availability and closeness of substitutes: The most important determinant. When close alternatives exist (such as competing supermarket butter brands), demand is price elastic because buyers easily switch. Where few substitutes exist (such as peak-time rail travel or insulin), demand is price inelastic.
- Necessity versus luxury: Necessities (bread, domestic electricity) are essential for everyday life, making demand inelastic. Luxuries (foreign holidays, designer bags) can be postponed, making demand elastic.
- Proportion of disposable income spent: Goods that absorb a tiny fraction of household income (table salt, matches) have inelastic demand because a 20% price increase adds only a few cent to the bill. High-ticket items (cars, home renovations) take a large share of income, making consumers sensitive to price.
- Habit-forming or addictive nature: Goods such as cigarettes or alcohol face inelastic demand because physical addiction or ingrained routine limits consumer cutbacks when prices rise.
- Time period: Demand is more inelastic in the short run because consumers need time to change routines. In the long run, demand becomes more elastic. When Irish petrol prices climbed past €2 per litre in March 2022, motorists had to pay immediately; over several years, commuters can purchase electric vehicles, arrange carpools, or switch to rail.
Elasticity and Total Revenue
Total revenue is the gross income received by a seller, calculated as:
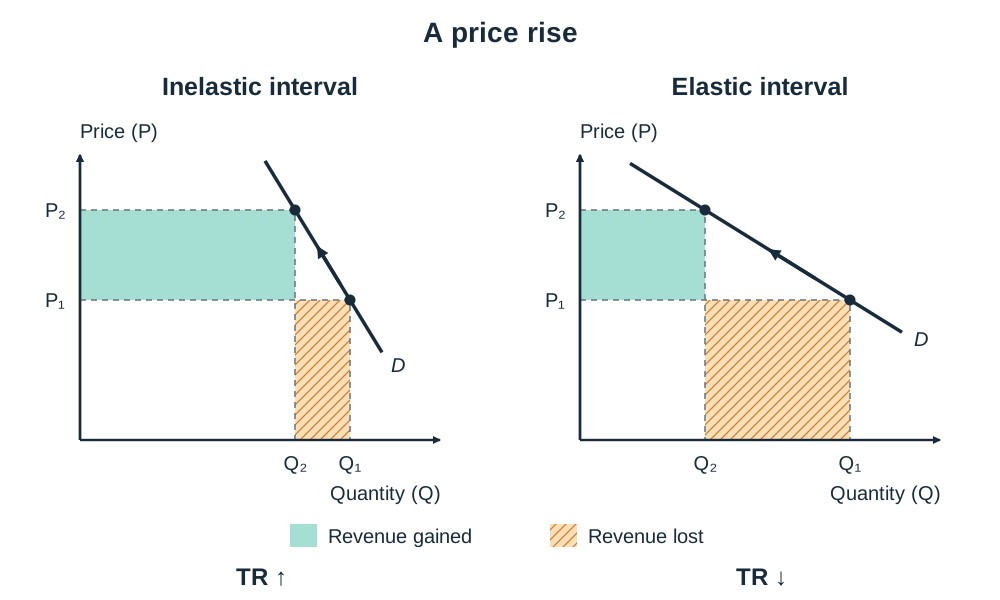
When a seller changes price, the price effect and the quantity effect pull total revenue in opposite directions. PED determines which effect wins:
- If demand is price inelastic ():
- Raising price increases total revenue (percentage fall in sales is smaller than percentage price rise).
- Cutting price reduces total revenue.
- If demand is price elastic ():
- Cutting price increases total revenue (percentage rise in sales exceeds percentage price cut).
- Raising price reduces total revenue.
- If demand is unit elastic ():
- Changing price leaves total revenue unchanged.
Always remember that total revenue is not profit. Profit equals total revenue minus total costs (). Selling more units at lower prices raises operating and materials costs, so revenue-maximising pricing is not automatically profit-maximising.
Individual consumers also use PED concepts when budgeting. Spending on price-inelastic essentials such as electricity, rent, and commuting fuel cannot easily be cut when prices rise, so a price increase in those items squeezes the money left for price-elastic discretionary purchases, which is where a household realistically economises.
Income Elasticity of Demand (YED) and Applications
Income Elasticity of Demand (YED) measures the responsiveness of the quantity demanded of a good to a change in consumer income, ceteris paribus.
Worked Example: Calculating YED Suppose consumer income rises from €40,000 to €50,000, and quantity demanded rises from 150 to 180 units:
- Step 1: Calculate percentage changes:
- Step 2: Apply the formula:
- Step 3: Economic meaning:
- The positive sign (+0.8) indicates that the product is a normal good (demand rises as income rises).
- Because the value is between 0 and 1 (), demand is income inelastic, meaning the good is a necessity — quantity demanded changes by a smaller percentage than income.
In PED, the minus sign only confirms the Law of Demand. In YED, the sign does the real work: a positive YED means a normal good and a negative YED means an inferior good.
YED Classifications
- Normal Good (): Demand increases as consumer income rises. An increase in income shifts the demand curve to the right.
- Necessity (): Income inelastic. Demand rises by a smaller percentage than the increase in income (e.g. domestic electricity, milk, bread).
- Luxury Good (): Income elastic. Demand expands by a larger percentage than the increase in income (e.g. overseas holidays, fine dining, private healthcare).
- Inferior Good (): Demand decreases as consumer income rises because households switch to higher-quality alternatives (e.g. basic own-brand groceries, second-hand clothing). An increase in income shifts the demand curve to the left.
Practical Forecasting Formula
Firms use this formula to forecast sales when macroeconomic conditions change. For example, if national income is forecast to fall by 4% during a downturn and a retailer sells a luxury good with , sales volume will fall by approximately , alerting management to reduce stock orders and staffing.
How YED is Used in Decision-Making
- Individuals: Households use YED to manage personal finances. During income growth, spending on income-elastic luxuries expands rapidly. If household income falls, cuts are made first to luxuries, while spending on income-inelastic necessities stays steady.
- Firms: Businesses use YED to plan product lines and inventory through the economic cycle. Luxury retailers expand during economic booms but must scale back during recessions. Supermarkets stock more own-brand budget products when real incomes fall. Diversifying across both necessities and luxuries stabilises a firm's cash flow.
- Government: The Department of Finance uses YED to forecast tax receipts. During an economic downturn, VAT receipts from income-elastic goods (cars, restaurant dining, electronics) fall faster than the drop in national income. YED also informs state infrastructure planning: as national income rises, demand for air travel, public transport, and third-level education expands faster than income.
- Agricultural Economics: Basic agricultural produce has low income elasticity (). As national income grows, consumers spend a smaller proportion of their extra income on basic food items. This explains why farm incomes historically grow more slowly than industrial or services incomes.
Cross Price Elasticity (CED) and Elasticity of Supply (PES)
Cross Price Elasticity of Demand (CED)
Cross Price Elasticity of Demand measures the responsiveness of the quantity demanded of Good A to a change in the price of Good B, ceteris paribus:
The algebraic sign reveals the relationship between the two goods:
- Positive CED (): The goods are substitutes (e.g. Barry's Tea and Lyons Tea). When the price of Good B rises, consumers switch to Good A, increasing demand for Good A.
- Negative CED (): The goods are complements (e.g. game consoles and console games). When the price of Good B rises, sales of Good B fall, dragging down demand for companion Good A.
- CED = 0: The goods are completely unrelated.
Price Elasticity of Supply (PES)
Price Elasticity of Supply measures the responsiveness of the quantity supplied of a good to a change in its own price, ceteris paribus:
Because producers supply more when prices rise (the Law of Supply), PES is normally positive.
- PES > 1 (Price Elastic Supply): Producers can increase output quickly and easily.
- 0 < PES < 1 (Price Inelastic Supply): Output can only be expanded slowly or at significant marginal expense.
- PES = 0 (Perfectly Inelastic Supply): Quantity supplied is completely fixed regardless of price. On a diagram with Price (€) on the vertical axis and Quantity on the horizontal axis, this is drawn as a vertical supply curve.
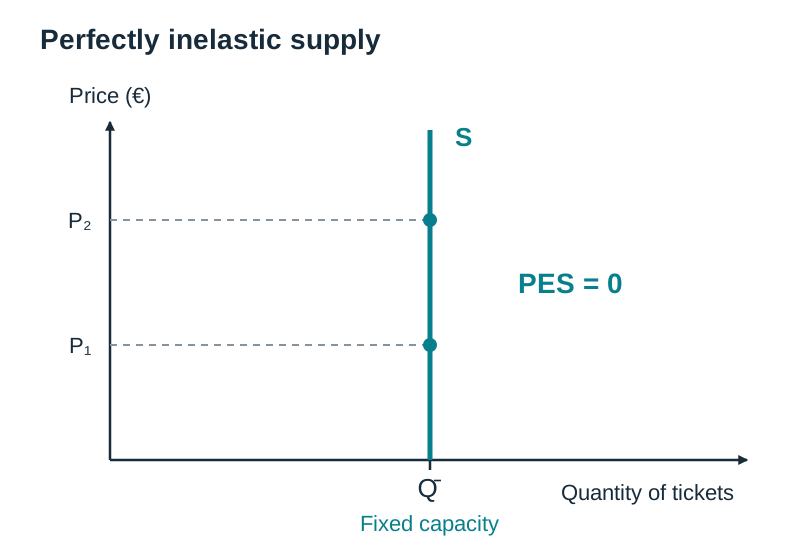
Fixed Capacity and the Vertical Supply Curve
A vertical supply curve appears frequently in exam questions concerning events and venues (e.g. a sold-out match at the Aviva Stadium, World Cup tickets, or a 400-seat music hall). The stadium has a fixed physical capacity. Even if ticket prices rise sharply on the resale market, no additional seats can be manufactured for that match in the short run, meaning quantity supplied cannot change.
Taxation, Tax Incidence, and Limitations of Elasticity
The Irish government relies directly on elasticity when designing fiscal policies.
Revenue Taxes versus Corrective Taxes
- Revenue-raising taxes: Imposed on goods with price-inelastic demand (petrol, diesel, tobacco, alcohol). Because consumers cut back by a smaller percentage than the price rise, the tax base remains intact and Exchequer revenue is stable and predictable.
- Corrective taxes (behaviour change): Imposed to discourage harmful consumption. These succeed best when demand is price elastic. The 2002 Irish plastic bag levy (15 cent) cut usage by over 90% in its first year because reusable shopping bags were cheap, readily available substitutes. Similarly, the 2018 Sugar-Sweetened Drinks Tax encouraged consumers to switch to water or sugar-free soft drinks.
Tax Incidence: Who Actually Pays the Tax?
When an indirect tax (excise duty, VAT, carbon tax) is placed on a good, the firm chooses how much of that tax to pass on to the retail consumer:
- Inelastic Demand: If demand is price inelastic, consumers cannot easily switch away. The firm passes most of the tax on as a higher retail price, meaning the tax burden falls predominantly on the consumer.
- Elastic Demand: If demand is price elastic, passing on the full tax would wipe out sales volume. The firm absorbs a larger share of the tax out of its profit margins, meaning the burden falls primarily on the producer.
The Regressive Impact of Taxes on Necessities
A regressive tax takes a higher percentage of income from low-income households than from high-income households. Flat excise duties and carbon taxes on inelastic necessities (such as home heating oil and vehicle fuel) are inherently regressive. A rural worker earning €25,000 and an executive earning €150,000 pay the exact same duty per litre, but that duty represents a far higher percentage of the low earner's weekly disposable income.
Limitations of Elasticity Models in Practice
- Violation of the Ceteris Paribus Assumption: In real markets, competitor prices, consumer confidence, and disposable incomes change simultaneously. It is difficult to isolate the exact impact of an isolated price movement.
- Reliance on Historical Data: Elasticity coefficients are calculated from past consumer reactions. Changes in technology or inflation expectations mean that an elasticity figure calculated before the 2022 energy price shock may not hold true today.
- Supply-Side Reformulation: Real-world policies cause supply changes as well as demand responses. Following the introduction of the Sugar-Sweetened Drinks Tax, much of the drop in sugar intake occurred because drink manufacturers reformulated recipes to lower sugar levels below the tax threshold, rather than solely because of consumers changing buying habits.
Key terms
- Price Elasticity of Demand (PED)
- A measure of the responsiveness of the quantity demanded of a good to a change in its own price, ceteris paribus.
- Income Elasticity of Demand (YED)
- A measure of the responsiveness of the quantity demanded of a good to a change in consumer income, ceteris paribus.
- Cross Price Elasticity of Demand (CED)
- A measure of the responsiveness of the quantity demanded of one good to a change in the price of another good, ceteris paribus.
- Price Elasticity of Supply (PES)
- A measure of the responsiveness of the quantity supplied of a good to a change in its own price, ceteris paribus.
- Ceteris Paribus
- A Latin phrase meaning 'all other things remaining equal', an essential condition used in economic models to isolate the impact of a single variable.
- Price Inelastic Demand
- A condition where the percentage change in quantity demanded is smaller than the percentage change in price, giving an absolute value between 0 and 1 (0 < |PED| < 1).
- Price Elastic Demand
- A condition where the percentage change in quantity demanded is greater than the percentage change in price, giving an absolute value greater than 1 (|PED| > 1).
- Unit Elastic Demand
- A condition where the percentage change in quantity demanded exactly matches the percentage change in price (|PED| = 1), leaving total revenue unchanged.
- Perfectly Inelastic Demand
- A condition where quantity demanded remains completely unchanged regardless of price (|PED| = 0), represented graphically as a vertical demand curve.
- Perfectly Inelastic Supply
- A condition where quantity supplied cannot change regardless of price (PES = 0), represented graphically as a vertical supply curve, typically due to fixed venue capacity.
- Normal Good
- A good for which quantity demanded increases as consumer income rises, represented by a positive income elasticity of demand (YED > 0).
- Inferior Good
- A good for which quantity demanded decreases as consumer income rises, represented by a negative income elasticity of demand (YED < 0).
- Necessity
- A normal good with an income elasticity between 0 and 1 (0 < YED < 1), meaning demand increases by a smaller percentage than the rise in income.
- Luxury Good
- A normal good with an income elasticity greater than 1 (YED > 1), meaning demand expands by a larger percentage than the rise in income.
- Substitutes
- Goods in competitive demand that can be used in place of each other, having a positive cross price elasticity of demand (CED > 0).
- Complements
- Goods in joint demand that are used together, having a negative cross price elasticity of demand (CED < 0).
- Total Revenue
- The total money a firm receives from selling its output, calculated as price multiplied by quantity sold (TR = P × Q).
- Arc (Midpoint) Formula
- An elasticity formula measuring responsiveness over an interval using the sums of original and new values: (ΔQ / ΔP) × ((P1 + P2) / (Q1 + Q2)).
- Regressive Tax
- A tax that takes a larger percentage of income from low-income earners than from high-income earners.
Check yourself
A product has a PED of -0.4. Should the firm increase or decrease price to raise total revenue, and why?
The firm should increase price. Because demand is price inelastic (|PED| = 0.4 < 1), the percentage fall in quantity sold is smaller than the percentage rise in price, causing total revenue to increase.
A stadium with 50,000 seats completely sells out for an international rugby match. Describe the supply curve for match tickets and explain its economic cause.
The supply curve is a vertical line, representing perfectly inelastic supply (PES = 0). The stadium has a fixed physical capacity of 50,000 seats, so no extra tickets can be supplied in the short run regardless of how high ticket prices rise.
The Cross Price Elasticity of Demand between Good A and Good B is calculated as -2.5. Identify the relationship between the two goods and explain what the sign means.
Good A and Good B are complements (goods consumed jointly). The negative sign indicates that when the price of Good B rises, demand for Good A falls.
Using the following YED values: Domestic Electricity (+0.1), Instant Noodles (-0.5), and Designer Watches (+3.5), identify one necessity and one inferior good, justifying each choice.
Domestic electricity is a necessity because its YED is positive but less than 1 (+0.1), meaning demand rises by a smaller percentage than income. Instant noodles is an inferior good because its YED is negative (-0.5), meaning demand contracts as consumer income rises.
Why is an excise duty on home heating fuel considered a regressive tax?
It is regressive because the duty is a flat rate per unit, taking a larger percentage of disposable income from low-income households than from high-income households.
State the four core formulas for PED, YED, CED, and PES.
PED = %ΔQd / %ΔP; YED = %ΔQd / %ΔY; CED = %ΔQd(Good A) / %ΔP(Good B); PES = %ΔQs / %ΔP.