
Economic growth and economic development describe two fundamentally different dimensions of national progress. Growth tracks the quantitative expansion of an economy's output using national accounting metrics like real Gross Domestic Product (GDP) and Modified Gross National Income (GNI*), while development captures qualitative structural changes in living standards, healthcare, education, human capabilities, and social equality. This topic covers how economies are profiled across income, wealth, and distribution; how the factors of production drive long-term progress; how the Inequality-adjusted Human Development Index (IHDI) measures development lost to inequality; and how Ireland delivers bilateral and multilateral assistance through Irish Aid.
Economic Growth versus Economic Development
| Dimension | Economic Growth | Economic Development |
|---|---|---|
| What it measures | Quantitative expansion in real output | Qualitative improvement in living standards and structural change |
| How it is measured | Annual % change in real GDP, GNI, or real GDP per capita | Composite indices (HDI, IHDI), literacy, life expectancy, poverty rates |
| Nature of change | Purely numerical and material | Multi-dimensional (social, institutional, economic, environmental) |
| Timeframe | Short to medium term (can change in a single year) | Long term (typically takes decades to achieve) |
The single most important distinction in this topic is between how much an economy produces and how well its people actually live.
Economic Growth: Actual versus Potential
Economic growth is an increase in the real output of an economy over a period of time, usually measured as the annual percentage increase in real GDP or real GDP per capita. In national accounting, 'real' means the output figure is adjusted for inflation, isolating changes in physical volume from changes in prices.
Economists distinguish between two types of growth:
- Actual growth: An increase in real output actually produced. On a Production Possibility Curve (PPC), this is shown by a movement from a point inside the curve outwards towards the boundary, such as when unemployed resources are put back to work during a recovery.
- Potential growth: An increase in the economy's capacity to produce goods and services. This is shown by an outward shift of the entire PPC, which happens when the factor endowment grows or technology advances.
Growth figures are usually quoted for total real output, but living standards depend on output per person:
If an economy expands its real output by 3% in a year while its population also grows by 3%, output per person is unchanged and the average material standard of living has not improved. This distinction is vital when comparing developed economies with fast-growing developing nations where high birth rates absorb a large share of headline output gains.
Economic Development and Sustainable Development
Economic development is a qualitative concept. It refers to a sustained increase in real income per capita accompanied by fundamental structural changes across society. These changes include rising life expectancy, lower infant mortality, universal literacy, access to medical care, modern sanitation, civil liberties, and environmental protection. While growth asks how fast the national economic pie is expanding, development asks whether people's lives — their health, education, and opportunities — actually get better.
An economy can experience growth without genuine development. For example, a country discovers offshore gas, real GDP jumps, but the profits go to foreign shareholders and a small elite while schools and clinics do not improve. If extraction also causes environmental degradation, community welfare declines even as headline output surges.
This connects directly to sustainable development: meeting the needs of the present without compromising the ability of future generations to meet their own needs. Growth is sustainable only when the social and ecological costs are managed so that the resource base is not degraded.
Benefits and Costs of Economic Growth
Benefits of growth:
- Higher living standards: More goods and services are available per person, lifting households out of poverty.
- Higher employment: Expanding output raises the derived demand for labour, lowering unemployment and curbing forced emigration.
- Increased fiscal revenue: Greater incomes, consumer spending, and corporate profits yield higher receipts from PAYE, VAT, and corporation tax without needing higher tax rates. This funds public services.
- Reduced social transfer burdens: Lower unemployment reduces state expenditure on Jobseeker's Allowance, improving the government budget balance.
- Virtuous investment cycle: Profitable firms reinvest retained earnings into capital equipment and research, expanding future capacity.
Costs of growth:
- Environmental degradation: Higher production often brings increased greenhouse emissions, industrial waste, and depletion of non-renewable resources.
- Inflation and overheating: If aggregate demand expands faster than productive capacity, shortages emerge and price levels rise, particularly in housing.
- Inequality: Gains can accrue disproportionately to owners of capital and specialised workers, widening income and wealth gaps.
- Infrastructure bottlenecks: Rapid growth strains public transport, water networks, electricity grids, and hospital capacity.
- Opportunity cost of capital formation: Shifting resources into capital goods today means sacrificing consumer goods in the short run.
Profiling Countries and Regions: Income, Wealth, and Equality
To evaluate national and regional economic performance, economists profile economies across three dimensions: income flows, wealth stocks, and distribution metrics.
1. National Income Concepts: GDP, GNP, GNI, and GNI*
- Gross Domestic Product (GDP): The total monetary value of all final goods and services produced within the geographic borders of a country in one year, regardless of whether the producers are domestic or foreign-owned.
- Gross National Product (GNP): The total value of goods and services produced by the permanent residents and domestically owned factors of production of a country in one year:
Net factor income from abroad is the difference between factor income earned abroad by domestic residents and factor income earned domestically by non-residents and sent out of the country.
- Gross National Income (GNI): GNP measured at market prices. In Leaving Certificate Economics, GNP and GNI are used interchangeably.
In Ireland, GNP and GNI are substantially smaller than GDP — typically by 20% to 25% — because foreign multinationals generate large profits in Ireland and repatriate them to parent companies overseas. That outflow is counted in Irish GDP but excluded from Irish GNP and GNI.
To compare living standards internationally, economists adjust GNI per capita for Purchasing Power Parity (PPP). PPP adjusts market exchange rates to reflect differences in domestic price levels, recognising that a euro or dollar buys a different basket of basic goods and services in different countries.
Why Ireland Uses Modified Gross National Income (GNI*)
Irish headline GDP and GNI remain distorted by multinational accounting practices, particularly following the 2015 'leprechaun economics' revision where GDP rose by over 25% in a single year due to balance-sheet relocations. To provide an accurate picture of domestic economic activity, the Central Statistics Office (CSO) developed *Modified Gross National Income (GNI)**.
GNI* starts with GNI and strips out three specific multinational accounting elements:
- Depreciation on foreign-owned intellectual property assets located in Ireland.
- Depreciation on aircraft owned by Irish-resident aircraft-leasing companies.
- The retained (undistributed) profits of redomiciled companies (firms that moved their legal headquarters to Ireland without shifting substantial operations).
Profits actually repatriated abroad are already deducted at the earlier step when GDP is converted to GNP/GNI. GNI* is the indicator cited by Irish policymakers when measuring genuine domestic living standards, national debt sustainability, and fiscal ratios.
Limitations of GDP per Capita as a Welfare Indicator
While useful as an initial benchmark, GDP per capita has major limitations as a measure of living standards:
- Hides income distribution: Because it is an arithmetic average, high GDP per capita can coexist with severe poverty if income is concentrated in the hands of an elite.
- Excludes unrecorded and non-market activity: The black economy, subsistence farming, unpaid childminding, and volunteer work are omitted, which understates real output, especially in developing economies.
- Ignores output composition: Spending on armaments, prisons, or emergency clean-ups following an oil spill adds to GDP but does not improve human wellbeing.
- Ignores negative externalities: Industrial pollution, traffic congestion, and resource depletion degrade living standards but are not deducted from GDP.
- Omits non-material factors: Working conditions, leisure time, personal safety, mental wellbeing, life expectancy, and literacy are absent from the calculation.
- Distorted in Ireland: Headline GDP per capita reflects multinational profit routing rather than money available to Irish households.
2. Wealth Measures
Income is a flow of money earned over time (wages, rent, dividends), whereas wealth is a stock of accumulated financial and physical assets owned at a point in time, minus total liabilities. Wealth includes housing, farmland, savings, equities, and private pensions. Across all market economies, wealth is distributed far more unequally than income because capital accumulates over generations through compound returns and inheritance. The CSO Household Finance and Consumption Survey provides the benchmark data on Irish household wealth.
3. Equality Indicators
- Gini Coefficient: A numerical ratio measuring income or wealth inequality derived from the Lorenz curve, which graphs cumulative population against cumulative income. The Gini coefficient ranges from 0 (perfect equality, where everyone has identical income) to 1 or 100% (complete inequality, where one person earns everything). A lower number means a more equal distribution.
- Example: Country A has a Gini coefficient of 0.26 and Country B has 0.52. Country A is the more equal society, with its Lorenz curve lying closer to the 45-degree line of absolute equality. According to the CSO Survey on Income and Living Conditions (SILC), Ireland's Gini coefficient for disposable income sits around 0.27 to 0.29, which is much lower than its market-income Gini (before taxes and transfers). This gap demonstrates the strong redistributive impact of Ireland's progressive tax and social welfare system.
- Palma Ratio: The income share of the richest 10% of the population divided by that of the poorest 40%:
It focuses on the two extremes because the middle 50% of the population typically claims around half of national income across most countries.
Regional Profiling in Ireland
National figures often conceal regional imbalances. CSO county and regional accounts reveal that Dublin and the Mid-East consistently generate higher disposable income per person than the Border and Midlands regions. These gaps are caused by differing industrial bases, infrastructure access, and FDI clustering. Progressive direct taxation and social transfers narrow these market inequalities, reallocating spending power to regional communities.
How Factors of Production Drive Growth and Development
An economy expands its productive potential by increasing the quantity of its factors of production, improving their quality, or combining them more efficiently.
The Four Primary Factors
- Labour: Workforce expansion occurs through population growth, net inward migration, and rising participation rates (such as more women entering the workforce). However, simply adding more workers to a fixed stock of tools brings diminishing returns. Long-term gains require improvements in worker skills, organisation, and public health.
- Capital: Physical capital encompasses factories, plant machinery, transport infrastructure, and digital communications. Deepening the capital stock — providing more and better equipment per worker — raises labour productivity and lowers unit costs.
- Human Capital: The accumulated knowledge, practical competencies, technical qualifications, and health status embodied in the workforce. Investing in human capital raises output directly and builds domestic absorptive capacity — the ability of local workers and domestic firms to identify, assimilate, and exploit advanced technologies brought in by foreign direct investment. Ireland's introduction of free second-level education in 1967 transformed its human capital base, underpinning decades of high-tech and pharmaceutical investment.
- Technology and Total Factor Productivity (TFP): Technology is the application of scientific discovery to production processes. Total Factor Productivity measures the efficiency with which combined inputs of labour and capital are converted into final output. Technological progress shifts the production function upwards, allowing an economy to produce more output from the same volume of factor inputs and offsetting diminishing marginal returns.
Supporting Factors: Institutions and Resources
- Institutions: Markets cannot function efficiently without a supportive institutional framework. Independent courts, secure property rights, enforceable contracts, low corruption, and stable banking systems lower transaction costs and encourage long-term capital investment.
- Natural Resources and Land: Fertile soil, minerals, natural deep-water ports, and renewable energy resources provide an initial advantage. However, relying purely on raw commodity exports can trigger Dutch disease, where resource exports push up the exchange rate and damage domestic manufacturing.
Obstacles to Development in a Less-Developed Economy
Why do less-developed nations find it difficult to generate sustained growth and development?
- The poverty trap (low savings, low investment): Low household incomes mean families must spend everything on immediate survival, leaving little domestic savings. Low savings mean banks lack funds to lend for capital investment. Without capital accumulation, labour productivity and incomes remain low, locking the cycle in place.
- Infrastructure deficits: Inadequate roads, ports, electricity grids, and water systems raise transport and production costs, cutting rural producers off from regional markets.
- Human capital deficits and brain drain: Limited access to primary schooling and healthcare keeps productivity low. When workers do acquire advanced qualifications, many emigrate to higher-income countries, depriving the domestic economy of vital skills.
- Primary product dependence: Specialising in agricultural or mineral commodities (like coffee, cocoa, or copper) leaves an economy vulnerable to volatile global commodity prices and adverse weather events like droughts.
- Rapid population growth: High fertility rates mean total output must grow rapidly just to keep real income per person from falling.
- Political instability, civil conflict, and corruption: Unstable governance destroys physical capital, deters FDI, and diverts public revenues away from schools and clinics into military spending.
- External debt burdens: High debt-service obligations require governments to divert tax revenue into foreign interest payments rather than domestic infrastructure or health.
Ireland's contrasting path: Ireland overcame many of these structural barriers over the second half of the twentieth century through free second-level education (1967), joining the European Economic Community (1973) and utilising EU structural funds, adopting a low corporation tax regime to attract multinational investment, and benefiting from an English-speaking, educated workforce with full access to the EU single market.
Illustrating Growth on a Production Possibility Curve (PPC)
To illustrate growth on a diagram, sketch a Production Possibility Curve with capital goods on the vertical axis and consumer goods on the horizontal axis. The curve, PPC1, is bowed outwards away from the origin (concave) because resources are not equally adaptable to producing both goods, reflecting increasing opportunity costs.
- Actual growth is represented by a movement from a point inside PPC1 (where resources are unemployed or underemployed) toward the curve.
- Potential growth is shown by drawing a new curve, PPC2, lying outside PPC1 at every point, accompanied by an outward-pointing arrow. Label this shift clearly as economic growth.
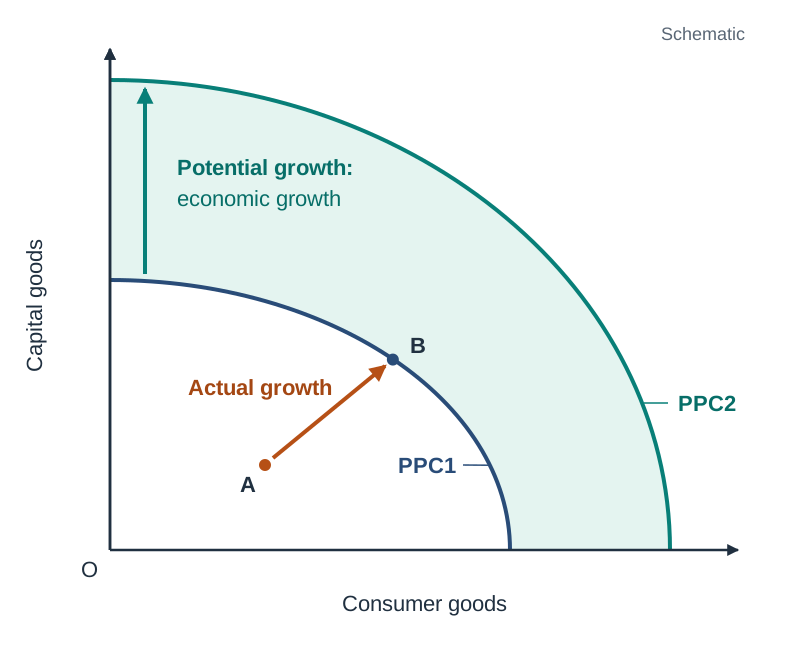
If the improvement in factors applies equally across the economy (such as an overall rise in the working-age population), the curve shifts outwards symmetrically. If the advance is sector-specific (such as new software that benefits capital equipment production), the curve pivots outwards further along the capital-goods axis.
The diagram also illustrates an essential intertemporal trade-off: allocating more resources today to capital goods requires producing fewer consumer goods in the short run. This sacrifice yields a larger outward shift to PPC2 in future years, raising long-term living standards.
Comparing Development: The Human Development Index and the IHDI
Because GDP per capita fails to reflect broader human welfare, the United Nations Development Programme (UNDP) created the Human Development Index (HDI). The HDI is a composite index ranging from 0 to 1, calculated as the geometric mean of three dimensions:
- Health: Measured by life expectancy at birth.
- Education: Measured by mean years of schooling for adults aged 25 and over, together with expected years of schooling for a child entering school today.
- Standard of living: Measured by Gross National Income (GNI) per capita adjusted for Purchasing Power Parity (PPP).
The Inequality-adjusted Human Development Index (IHDI)
While standard HDI captures more than national income accounts, it remains a national average. If high incomes, clean water, and advanced schooling are concentrated in a capital city while rural communities lack basic clinics, standard HDI still reports a respectable score. To expose these internal disparities, the UNDP introduced the Inequality-adjusted Human Development Index (IHDI).
The IHDI discounts each of the three dimensions according to the degree of inequality across the population:
- Where there is no inequality across citizens, the IHDI equals the HDI.
- As inequality across health, schooling, and income rises, the IHDI falls further below the HDI.
- The IHDI can never exceed the standard HDI.
The percentage gap between the two measures is the inequality loss:
Comparative Analysis: Ireland versus Ethiopia
(Data reference: UNDP Human Development Reports; use the most recent published HDR figures in your exam answers and state the data year)
| Indicator | Ireland | Ethiopia |
|---|---|---|
| HDI Score | ~0.949 (Very High) | ~0.497 (Low) |
| IHDI Score | ~0.886 | ~0.336 |
| Inequality Loss | ~6.6% | ~32.4% |
Ireland's HDI places it in the 'Very High' development tier, supported by a life expectancy exceeding 82 years, extensive third-level participation, and high GNI* per person. Its inequality loss of roughly 6.6% shows that educational access, healthcare, and purchasing power are distributed relatively evenly across society, helped by progressive taxation and targeted social transfers.
By contrast, Ethiopia's standard HDI sits at approximately 0.497 and its IHDI falls to roughly 0.336, representing an inequality loss of over 32%. Ethiopia loses almost one-third of its human development potential to internal disparities. While Ireland's IHDI score is roughly 2.6 times Ethiopia's, remember that the HDI is an index rather than a physical measure of welfare; this ratio highlights the scale of the structural gap rather than meaning an Irish citizen is '2.6 times better off'.
These metrics highlight sharply contrasting policy priorities for the two economies:
- Ireland's priorities: Relieving public infrastructure bottlenecks in water and transport, expanding affordable housing, narrowing urban-rural regional income divides, and investing in research and development to sustain high-wage employment.
- Ethiopia's priorities: Expanding primary healthcare clinics, improving rural primary and secondary schooling completion, delivering rural electrification and clean drinking water, and investing in climate-resilient agriculture to withstand droughts.
Ireland's Overseas Development Programme: Irish Aid
Official Development Assistance (ODA) refers to government aid provided to developing nations to promote economic welfare and poverty reduction. Ireland delivers its bilateral and multilateral aid through Irish Aid, the Government's official programme for overseas development, which is managed by a division of the Department of Foreign Affairs.
Ireland's international development policy is set out in A Better World (2019). The policy is Ireland's direct response to the UN 2030 Agenda for Sustainable Development and its 17 Sustainable Development Goals (SDGs), which cover poverty, hunger, quality education, gender equality, and climate action. The operational principle of A Better World is 'reaching the furthest behind first', targeting the poorest communities, particularly in fragile or conflict-affected regions.
Four Core Priority Areas
- Gender Equality: Removing barriers to female schooling, combating gender-based violence, and securing legal rights to land and credit for female farmers.
- Reducing Humanitarian Need: Delivering emergency food, clean drinking water, and medical aid during armed conflicts, natural disasters, and refugee crises.
- Climate Action: Helping smallholder farmers adapt to shifting rainfall through drought-resistant seeds, rainwater harvesting, solar-powered irrigation, and soil conservation.
- Strengthening Governance: Funding honest public financial management, the rule of law, human rights protections, and independent anti-corruption bodies.
Evaluating Effectiveness: The Results Chain Framework
Economists evaluate development assistance by tracking programmes through a four-stage results chain. Spending money (an input) does not prove that a programme has achieved real benefits (outcomes and impacts):
| Stage | Meaning | Practical Example (Education & Gender) |
|---|---|---|
| Input | Financial, human, and material resources committed | A €5 million grant allocated by Irish Aid to a regional education authority |
| Output | Tangible facilities, goods, or services directly delivered | 35 primary schools built; 150 female teachers recruited and trained |
| Outcome | Short-to-medium term behavioural changes or uptake | Female primary school completion rate rises from 48% to 72% |
| Impact | Long-term, sustainable socio-economic transformation | Higher female wages, reduced maternal mortality, improved household child nutrition |
Critical Evaluation: Strengths and Challenges of Irish Aid
Strengths of Irish Aid:
- 100% untied aid: Ireland's development assistance is untied aid, meaning recipient countries are not required to purchase goods or services from Irish firms. This allows funds to be spent on the most cost-effective local contractors and materials.
- Focus on least-developed countries: Ireland concentrates its bilateral aid on fragile states in sub-Saharan Africa (such as Ethiopia, Mozambique, Malawi, and Sierra Leone), targeting areas where external assistance has the highest marginal welfare impact.
- Local partnership and ownership: Programmes are co-designed with local community groups, public clinics, and non-governmental organisations (NGOs), building domestic administrative capacity rather than imposing outside solutions.
Challenges and limitations:
- Budget scale relative to UN target: In 2023 Ireland's Official Development Assistance, excluding Ukraine-related in-donor costs, was about €1.47 billion — roughly 0.38% of Gross National Income (Irish Aid Annual Report / OECD DAC); quote the most recent published figure, its year and its basis in your answer. While substantial, this remains below the longstanding UN target of 0.7% of Gross National Income that Ireland has committed to achieving by 2030.
- Denominator distortion: Because Ireland's GDP and GNI are inflated by multinational profits, the same euro contribution represents a smaller percentage of GNI than it would if measured against Modified Gross National Income (GNI*).
- External shocks: Armed conflict, civil instability, and severe droughts can destroy newly built infrastructure and reverse educational gains regardless of programme quality.
- Attribution and monitoring: Tracking long-term outcomes in remote regions with weak statistical records makes verifying lasting impact difficult.
The Wider Debate: Aid versus 'Trade Not Aid'
- Arguments in favour of foreign aid: Aid meets immediate humanitarian emergencies that markets will not address; it funds public goods with high social returns (roads, rural clinics, primary schools) that private investors will not finance; and it builds human capital that raises long-term productivity.
- Arguments against foreign aid: Prolonged aid can breed government dependency and weaken the incentive to build an effective domestic tax system; funds can be lost to corruption or administrative leakage; and free food aid can undercut local farmers, depressing domestic food production.
- The 'Trade Not Aid' argument: Many economists argue that opening wealthy markets to developing-world exports — by eliminating EU import tariffs and agricultural subsidies — would generate far more sustainable income than financial aid. Trade creates self-sustaining private revenue rather than dependency on donor budgets. The balanced conclusion is that trade access builds sustainable long-term wealth, while foreign aid remains essential for humanitarian relief and public goods that trade alone cannot provide.
Key terms
- Economic Growth
- The annual percentage increase in the real volume of goods and services produced by an economy over time, measured by real GDP or real GDP per capita.
- Economic Development
- A sustained increase in real income per capita accompanied by fundamental structural and qualitative improvements across society, such as higher literacy, better health, and lower inequality.
- Sustainable Development
- Development that meets the economic, social, and environmental needs of the present generation without compromising the ability of future generations to meet their own needs.
- Gross Domestic Product (GDP)
- The total monetary value of all final goods and services produced within a country's geographic borders in a year, regardless of ownership.
- Gross National Product (GNP)
- The total monetary value of all final goods and services produced by the permanent residents and domestically owned factors of production of a country in a year (GDP plus net factor income from abroad).
- Modified Gross National Income (GNI*)
- An Irish macroeconomic metric designed by the CSO that adjusts standard GNI by stripping out depreciation on foreign-owned intellectual property, depreciation on leased aircraft, and the retained profits of redomiciled firms.
- Purchasing Power Parity (PPP)
- An exchange rate adjustment that equalises the purchasing power of different currencies by eliminating price-level differences, allowing meaningful comparisons of living standards.
- Gini Coefficient
- A numerical measure of income or wealth inequality derived from the Lorenz curve, ranging from 0 (perfect equality) to 1 (complete inequality).
- Palma Ratio
- An inequality metric calculated by dividing the national income share earned by the richest 10% of the population by the share earned by the poorest 40%.
- Human Development Index (HDI)
- A composite United Nations metric combining health (life expectancy), knowledge (mean and expected years of schooling), and living standard (GNI per capita at PPP) into a score between 0 and 1.
- Inequality-adjusted HDI (IHDI)
- A human development metric that discounts each dimension of the standard HDI according to the observed level of inequality across the population.
- Inequality Loss
- The percentage reduction in an economy's standard HDI score when adjusted for internal inequality: [(HDI - IHDI) / HDI] * 100.
- Human Capital
- The accumulated knowledge, technical skills, competencies, and health embodied in the workforce that raise worker productivity and living standards.
- Absorptive Capacity
- The ability of domestic workers and domestic firms to identify, assimilate, and exploit advanced technologies and practices introduced by foreign firms.
- Total Factor Productivity (TFP)
- A measure of the efficiency with which combined factor inputs (labour and capital) are converted into aggregate output, driven primarily by technological progress.
- Official Development Assistance (ODA)
- Government funding provided to developing nations and multilateral development agencies to promote economic welfare and reduce poverty.
- Untied Aid
- Official development assistance granted without any condition requiring the recipient country to purchase goods or services from the donor country.
- A Better World
- The Irish government's official policy framework for international development, focused on gender equality, humanitarian need, climate action, and strengthening governance.
Check yourself
Give three reasons why GDP per capita is an imperfect measure of living standards.
It is an arithmetic average that hides income inequality; it excludes unrecorded black-economy activity and unpaid domestic work; and it ignores negative externalities like pollution while omitting non-material factors like health, literacy, and leisure.
What three specific adjustments does the CSO make to convert GNI into Modified Gross National Income (GNI*)?
It subtracts: (1) depreciation on foreign-owned intellectual property assets; (2) depreciation on leased aircraft; and (3) the retained profits of redomiciled companies.
A country has an HDI of 0.800 and an IHDI of 0.640. Calculate its percentage inequality loss.
[(0.800 - 0.640) / 0.800] 100 = (0.160 / 0.800) 100 = 20.0%.
What is the Palma ratio and how is it interpreted?
It is the income share of the richest 10% of the population divided by that of the poorest 40%. A higher ratio indicates that a larger share of national income is concentrated at the top relative to the bottom.
What are the three core dimensions that make up the United Nations Human Development Index (HDI)?
Health (life expectancy at birth), education (mean years of schooling for adults aged 25+ and expected schooling for school-age children), and standard of living (GNI per capita at PPP).
What is meant by 'absorptive capacity' in relation to human capital and foreign investment?
The ability of domestic workers and domestic firms to successfully recognise, assimilate, and exploit advanced technologies and business practices introduced by foreign multinational enterprises.
Outline one argument for providing overseas development aid and one argument in favour of 'trade not aid'.
For aid: it meets immediate humanitarian emergencies and funds essential public goods (schools, rural clinics) that private markets will not supply. In favour of 'trade not aid': reducing import tariffs allows developing nations to earn self-sustaining commercial export revenues, avoiding donor dependency.