

How many people are at work, and how many want work but cannot find it, are two of the clearest signs of how well the Irish economy is performing and of how people are living. Under Strand 4 (Topic 4.3), this topic covers three main areas: reading and describing CSO data on Ireland's labour force across demographic and regional dimensions, explaining why people become unemployed and evaluating what this costs the individual and the exchequer, and examining whether having a job is enough to keep a household out of poverty. For Higher Level you need accurate definitions and formulas, confident handling of CSO labour-market data, the causes of unemployment in the Irish context with a policy response for each, and Ireland's three official poverty measures. Derived demand provides the essential microeconomic link between product markets and factor hiring.
The Labour Force: Definitions, Measurement, and Key Formulas
The labour force consists of everyone who is either employed in paid work or unemployed under the ILO criteria (without work, available within two weeks, and actively seeking work). No welfare claim or registration is needed to be counted as unemployed. Individuals who are neither working nor looking for work are classified as economically inactive (outside the labour force). This inactive group includes retired people, full-time homemakers, family carers, and people unable to work due to illness or disability.
Full-time students are not automatically outside the labour force. Under the International Labour Organisation (ILO) rules used by Ireland's Central Statistics Office (CSO), a student who works part-time (even one hour a week) is counted as employed. A student who has no job, is actively looking for work, and is available to start within two weeks is counted as unemployed. Students are only economically inactive if they are not seeking work.
To be counted as officially unemployed under ILO criteria, a person must meet three conditions at the same time:
- Without work during the reference week;
- Available to take up work within the next two weeks; and
- Actively seeking work at some point during the previous four weeks.
The CSO gathers these figures every quarter through the Labour Force Survey (LFS). You must distinguish this survey from the Live Register. The Live Register is a monthly administrative headcount of people claiming Jobseeker's Benefit, Jobseeker's Allowance, or credited social welfare contributions. It is not an official measure of unemployment because it includes casual, part-time, and seasonal workers whose earnings fall below statutory thresholds, while leaving out jobless people who have other means or choose not to claim.
Core Labour Market Formulas
Always double-check the denominator before calculating. The employment rate and unemployment rate never add up to 100% because they divide by completely different groups: the unemployment rate divides by the active labour force, whereas the employment rate divides by the working-age population (aged 15–64).
Full employment describes an economic state where everybody in the labour force who is willing and able to work at existing wage rates is employed. It does not mean a 0% unemployment rate. In an open economy, unavoidable movements between jobs create an ongoing baseline of frictional and seasonal joblessness. In Ireland, full employment is considered to correspond to an unemployment rate of roughly 4% to 5%.
Investigating Ireland's Labour Force Trends across Six Dimensions
The specification expects you to interpret and comment on patterns in CSO labour force data across six dimensions. Keep in mind that headline figures shift across quarters, but the structural patterns remain consistent.
Age
Youth unemployment (workers aged 15–24) regularly runs at two to three times the national adult average, sitting near 10% to 12% even during economic booms (CSO LFS, Q2 2024). Younger workers face entry-level hurdles, lack established track records, and are often hired on temporary contracts under 'last-in, first-out' workplace practices. Meanwhile, the participation rate of older workers (aged 55–64) has climbed steadily due to rising statutory retirement ages, pension changes, and greater access to flexible and remote working arrangements.
Population
Ireland's population has expanded rapidly past 5.3 million (CSO Census and population estimates), driven by natural increases and substantial inward migration. Net inward migration expands the supply of labour, helping fill critical vacancies in multinational technology, construction, and healthcare. However, it also creates additional demand for accommodation, school places, and transport links.
Gender
The gap between male and female participation rates has narrowed significantly over the past three decades. Even so, the male employment rate (roughly 78%) remains higher than the female rate (roughly 70%) (CSO LFS, Q2 2024). Women still perform a disproportionate share of unpaid domestic care, face high early childhood childcare fees, and account for the vast majority of involuntary part-time employment.
Geographic Location
Employment is concentrated around major urban hubs, particularly the Greater Dublin Area, Cork, Galway, and Limerick. These cities host foreign direct investment (FDI) clusters in software, pharmaceuticals, and international financial services. Rural and Western counties display higher dependence on agriculture, tourism, and indigenous enterprise, alongside lower average weekly earnings and weaker public transport access.
Employment
Total employment in Ireland reached record levels above 2.7 million people (CSO LFS, Q2 2024). However, raw employment totals hide disparities in job quality and underemployment, where individuals working part-time hours want, and are available for, full-time hours.
Unemployment
National unemployment settled between 4.0% and 4.5% in 2023–2024, placing Ireland at technical full employment. By contrast, after the 2008 banking and property crash, unemployment spiked to roughly 16%, and during the initial COVID-19 restrictions in early 2020, the COVID-adjusted unemployment rate briefly neared 30%.
Writing a Trend Answer from CSO Data
When examination questions present a table or line chart and ask you to describe trends, follow this four-step structure:
- State the direction clearly: rising, falling, stable, or fluctuating.
- Quantify the change using start and end values, giving the correct units (thousands, %, or percentage points).
- Identify any turning point or outlier year that breaks the general trend.
- Provide an economic explanation if the question asks you to explain the movement.
Always distinguish levels from rates. Total employment can rise at the very same time the employment rate falls, provided the working-age population grows faster than the number of jobs created. Furthermore, watch the labour force participation rate. A drop in measured unemployment is not always good news; if discouraged workers abandon job-hunting, they leave the labour force, causing the headline unemployment rate to fall without any extra jobs being created.
Why Full Employment Is a Primary Economic Aim of the Government
Full employment exists when everyone in the labour force who is willing and able to work at existing wage rates is employed (equating to roughly 4% to 5% unemployment in Ireland). Government policy prioritises full employment for five core economic reasons:
- Higher exchequer tax revenues. Employed workers pay direct taxes through Pay As You Earn (PAYE) income tax, the Universal Social Charge (USC), and Pay Related Social Insurance (PRSI). Their consumer spending generates indirect tax receipts through Value Added Tax (VAT) and excise duties, providing the state with revenue to fund public services.
- Lower social protection expenditure. High employment cuts government spending on transfer payments such as Jobseeker's Benefit and Jobseeker's Allowance. This frees up current revenue for capital infrastructure projects, including public hospital beds, rail lines, and social housing.
- Higher national output and economic growth. When labour resources are fully utilized, the domestic economy operates on or close to its Production Possibility Frontier (PPF) rather than inside it. Higher production translates to higher Gross National Income (GNI*) and rising living standards.
- Poverty and inequality reduction. Earned wages provide the most dependable route out of financial deprivation, reducing the social and health costs linked to poverty.
- Retention of human capital and reduced emigration. Plentiful employment prevents the 'brain drain' of skilled third-level graduates, ensuring that state investments in primary, secondary, and higher education yield domestic economic returns.
Labour Demand and Factor Hiring Principles
Firms do not hire staff for personal satisfaction. The demand for labour is a derived demand, meaning it depends directly on consumer demand for the final goods and services that workers produce. For example, the demand for aircraft assembly workers is derived from consumer demand for commercial airline flights. If flight demand collapses, the demand for aviation assembly technicians and cabin crew falls immediately.
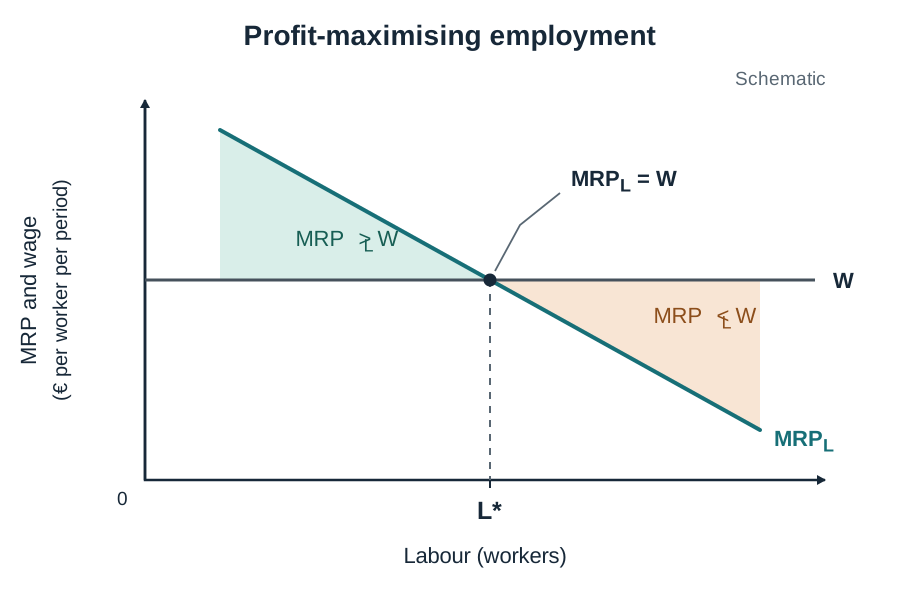
A profit-maximising business decides how many workers to employ by looking at the Marginal Revenue Product of Labour ():
Where:
- (Marginal Physical Product) is the additional physical output produced by adding one extra worker.
- (Marginal Revenue) is the extra income received from selling one additional unit of output. In a perfectly competitive product market where the firm takes the market price as given, , meaning .
The Profit-Maximising Hiring Rule: The firm continues hiring additional workers as long as (where represents the marginal wage cost). It stops hiring at the exact worker for whom:
At this point, the final worker brings in just enough extra revenue to cover their own wage cost, leaving total profit maximised. Beyond this point, hiring another worker would add more to wage costs than to revenue, pulling total profit down.
The demand curve for labour slopes downwards from left to right because of the Law of Diminishing Marginal Returns. As extra units of a variable factor (labour) are applied to fixed capital equipment and premises, the extra output produced per worker () eventually begins to fall, causing to fall with it.
The entire labour demand curve shifts outward to the right when:
- Consumer demand for the final product rises, increasing the selling price and marginal revenue;
- Worker productivity increases due to upskilling, education, or superior capital equipment, increasing ; or
- Non-wage employment costs, such as employer PRSI or compliance and training costs, fall. This reduces the total cost of taking on a worker, so the firm is willing to employ more labour at any given wage rate.
Causes of Unemployment and Targeted Policy Responses
Government policy cannot treat all joblessness with the same blunt instrument. An effective intervention must match the root cause; applying a demand-side tool to a structural problem wastes public funds without creating lasting jobs.
Key Terms: Traps and Disincentives
- Replacement ratio: The ratio of a person's net income while out of work (welfare payments plus secondary benefits such as the medical card or housing assistance) compared to their net take-home pay if they entered employment:
- Unemployment trap: Affects someone who is out of work. When the replacement ratio is high (approaching or exceeding 1.0), taking an entry-level job yields little or no additional income once travel costs and lost welfare supports are factored in, making it economically rational to remain on welfare.
- Poverty trap: Affects someone who is already in work. As an employee earns extra wages or takes on additional shifts, income tax, USC, and PRSI kick in while means-tested supports (like the Working Family Payment or housing subsidies) are withdrawn. The high effective marginal tax rate claws back most of the pay increase, leaving the worker stuck in poverty.
| Type of Unemployment | Definition | Irish Example | Targeted Policy Response |
|---|---|---|---|
| Cyclical (Demand-Deficient) | Caused by an economy-wide collapse in aggregate demand () during a recession, reducing derived demand for labour. | Job losses across retail, hospitality, and construction following the 2008 banking crash. | Expansionary fiscal policy: increased state capital expenditure on infrastructure and targeted tax cuts to stimulate consumer demand. |
| Structural | Long-term mismatch between the skills or location of jobseekers and the requirements of available vacancies. | Unemployed construction workers in 2009 lacking the skills required by expanding biopharma and tech multinationals. | State-sponsored retraining and apprenticeships through SOLAS, Education and Training Boards (ETBs), and Springboard+ courses. |
| Frictional | Short-term transitional unemployment while people switch careers, change locations, or enter the workforce from education. | College graduates searching for their first professional positions in June and July. | Improving labour-market information through Intreo offices, public employment services, and national online job portals. |
| Seasonal | Predictable, recurring calendar fluctuations in production and consumer demand. | Layoffs in seaside hospitality and tourism businesses along the Wild Atlantic Way during winter months. | Extending tourism shoulder-seasons via Fáilte Ireland initiatives, conference promotion, and enterprise diversification grants. |
| Classical (Real-Wage) | Real wages are pushed and held above the market-clearing equilibrium wage level by institutional wage floors. | Reductions in entry-level hours when statutory wage floors rise faster than productivity in low-margin sectors. | Setting minimum wages prudently on the advice of the Low Pay Commission, and reducing employer PRSI on lower earnings. |
Other Barriers Specific to Ireland
Acute shortages of affordable rental accommodation and public transport bottlenecks restrict geographic labour mobility. An unemployed worker in a regional town cannot easily accept a job in Dublin or Cork if local rents consume the entire entry wage. Expanding social and affordable housing delivery is therefore a supply-side labour market policy.
Classical Unemployment: The Wage-Floor Diagram in Words
Higher Level exam questions often ask you to explain the theoretical effects of a statutory minimum wage using economic concepts. You must be able to describe the standard neoclassical supply and demand diagram in clear prose:
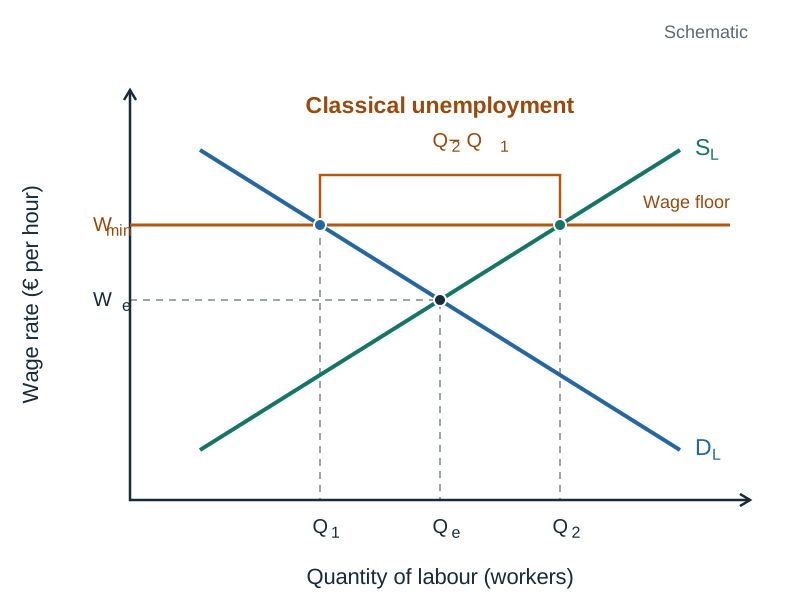
- Axes: The vertical axis represents the Wage Rate (€ per hour), and the horizontal axis represents the Quantity of Labour (number of workers or hours worked).
- Demand Curve (): Slopes downward from left to right, showing that employers demand more labour hours at lower wage rates due to diminishing marginal returns.
- Supply Curve (): Slopes upward from left to right, showing that higher hourly wage rates increase the opportunity cost of leisure, drawing more people into the active workforce.
- Market Equilibrium: Demand and supply intersect at equilibrium wage and employment level . The market clears with neither a surplus nor a shortage of labour.
- Imposing a Statutory Wage Floor (): When the government sets a legal minimum wage strictly above the market-clearing equilibrium wage (), a horizontal line is drawn across the diagram at this higher wage rate.
- At , the quantity of labour demanded by employers contracts along the demand curve from to , because higher wage costs reduce operating profit margins.
- At the same time, the quantity of labour supplied by workers expands along the supply curve from to , as higher pay attracts previously inactive individuals into the labour market.
- The resulting horizontal gap between supply and demand () represents an excess supply of labour, known as classical unemployment.
Applied Evaluation in the Irish Economy
In theoretical models, a wage floor causes unemployment. In practice, however, Ireland's National Minimum Wage has been raised repeatedly since 2016 without triggering large-scale job losses, as national employment climbed past 2.7 million. There are three economic explanations for this:
- Inelastic Labour Demand: In essential services (care work, security, food retail), employers cannot easily replace staff with machinery in the short term, so employment remains stable.
- Productivity and Morale Gains: Better pay reduces staff turnover, cuts recruitment costs, and boosts employee motivation, raising worker productivity towards the higher wage level.
- Monopsony Power: If large employers initially possessed buyer power in the local labour market and paid workers below their competitive value, a statutory wage floor can lift wages without reducing employment.
Evaluating the Impacts of Unemployment on the Individual and the Economy
Unemployment creates direct hardships for workers and systemic fiscal pressures for the wider economy.
Impacts on the Individual
- Loss of income: Earned wages stop immediately. The household must draw down savings and rely on state transfers like Jobseeker's payments, which provide an income well below average earnings.
- Skills atrophy: Prolonged absence from the workplace erodes technical proficiencies, workplace discipline, and knowledge of modern industry practices. Long-term unemployment (lasting 12 months or more) makes workers increasingly difficult to re-employ.
- Psychological and health damage: Joblessness is strongly associated with clinical depression, loss of personal dignity, anxiety, and household conflict.
- Long-term damage to earnings (scarring effect): Individuals who graduate or lose their livelihoods during a severe downturn experience permanently reduced lifetime earnings. They are frequently forced to accept lower-skilled, precarious roles to re-enter employment and never entirely catch up with peers who entered during an economic expansion.
Macroeconomic Impacts
- Lost national output: Unemployed labour represents an underutilised factor of production. The economy operates inside its Production Possibility Frontier (PPF), permanently forfeiting the goods and services those workers could have produced.
- The double fiscal burden: High unemployment damages the government budget from both sides at once:
- Government current spending automatically rises due to increased outlays on Jobseeker's payments and housing supports like the Housing Assistance Payment (HAP).
- Exchequer tax revenues fall sharply as receipts from PAYE income tax, USC, PRSI, and indirect taxes (VAT and excise) contract alongside falling consumer spending.
- Reduced long-run productive capacity: Persistent structural unemployment leads to human capital deterioration and early retirement, shifting the Long-Run Aggregate Supply () curve inward. In Ireland, severe unemployment spells have historically prompted outward migration, causing a 'brain drain' of skilled young workers.
Cross-Link: Closing the Deflationary Gap and Automatic Stabilisers
When actual national income falls short of the level required to achieve full employment, the shortfall in aggregate demand is known as a deflationary gap. The resulting joblessness is cyclical unemployment.
The government can close this gap through an injection of spending (such as direct capital investment in schools and transport) or a tax cut. Because of the multiplier effect, the required injection is smaller than the income gap itself:
Because Ireland is a small, highly open economy with a high Marginal Propensity to Import (MPM), our multiplier is small (often around 1.2 to 1.5). Much of any government spending injection leaks abroad to buy imported consumer goods, meaning domestic fiscal stimulus creates fewer domestic jobs than it would in a large, closed economy.
Automatic stabilisers help cushion these swings. During a recession, government spending on unemployment supports rises automatically while tax takes drop. This sustains basic consumer spending and curbs the depth of the cyclical downturn without requiring new legislation.
The Relationship Between Employment and Poverty
While employment remains the most effective protection against poverty, holding a job does not automatically guarantee financial security.
The CSO monitors living standards using three official poverty metrics:
- At Risk of Poverty: A relative income measure identifying individuals living in households where equivalised disposable income is below 60% of the national median. Disposable income includes all social welfare transfers and deducts direct taxes. Equivalisation adjusts household income based on the number of adults and dependent children living in the dwelling.
- Enforced Deprivation: Measures the share of the population unable to afford two or more basic essentials from an established list of eleven items (such as being able to heat the home adequately, buy new clothes, or eat meat, fish, or a vegetarian equivalent every second day).
- Consistent Poverty: The official headline target in Irish anti-poverty strategies. An individual is in consistent poverty only if they are simultaneously at risk of poverty (income under the 60% line) and experiencing enforced deprivation.
The Protective Effect of Work
CSO Survey on Income and Living Conditions (SILC, 2023) figures highlight the protective shield provided by paid employment:
- The consistent poverty rate among employed persons was 1.5%.
- The consistent poverty rate among unemployed persons was 9.4%.
- An unemployed individual is over six times more likely to experience consistent poverty than someone in active employment.
In-Work Poverty
Despite this protection, in-work poverty remains a serious economic issue: roughly 12.3% of employed individuals in Ireland experience enforced deprivation (CSO SILC, 2023). The primary causes are:
- Low hourly pay: Workers earning the statutory minimum wage in labour-intensive, low-margin sectors (hospitality, security, personal services).
- Involuntary part-time hours: Workers contracted for 15 to 20 hours per week who cannot secure full-time hours, leaving weekly take-home pay below the poverty line.
- Household dependency ratios: A single wage earner supporting dependent children or adult family members with care needs faces a much higher risk of poverty than dual-income households.
- Unavoidable living costs: Rapidly rising rents in the private rental sector and high childcare fees absorb a large share of take-home pay, so a wage that looks adequate on paper leaves little for other essentials.
Targeted Policy Responses
- Working Family Payment (WFP): A weekly, tax-free cash supplement paid to employees with children whose total family earnings fall below set income thresholds, preserving work incentives while preventing child poverty.
- National Childcare Scheme (NCS): State hourly subsidies paid directly to childcare providers to reduce out-of-pocket childcare fees for parents entering the workforce.
- Tapered welfare withdrawal: Gradually reducing welfare benefits rather than abruptly cutting them at an arbitrary earnings cut-off, removing the cliff edge that creates unemployment and poverty traps.
Key terms
- Labour Force
- The total number of people in an economy who are either employed in paid work or classified as unemployed under ILO criteria.
- Economically Inactive
- Individuals of working age who are neither in paid work nor actively seeking employment, such as retirees, carers, and students not seeking work.
- Unemployed (ILO)
- A person without work during the reference week who is available to start work within two weeks and has taken active steps to find work in the past four weeks.
- Labour Force Survey (LFS)
- The quarterly nationwide household survey conducted by the CSO to measure official labour force, employment, and unemployment rates.
- Live Register
- A monthly administrative headcount of individuals registering for Jobseeker's Benefit, Jobseeker's Allowance, or social welfare credits.
- Full Employment
- A situation where everybody in the labour force willing and able to work at prevailing wage rates has a job, corresponding to roughly 4% to 5% unemployment in Ireland.
- Derived Demand
- Demand for a factor of production (such as labour) that arises directly from the consumer demand for the final goods or services it helps produce.
- Underemployment
- A situation where an employed worker works fewer hours than they desire and are available to work, often seen in involuntary part-time contracts.
- Long-Term Unemployment
- Joblessness lasting for 12 continuous months or longer, typically characterised by skills atrophy and structural detachment.
- Discouraged Worker
- A jobless individual who desires work but has stopped actively searching because they believe no suitable jobs are available, thus exiting the official labour force.
- Replacement Ratio
- The ratio of an individual's net income while unemployed (welfare and secondary benefits) to their expected net take-home pay in employment.
- Unemployment Trap
- A situation where an unemployed person has little financial incentive to take up a job because out-of-work benefits are close to or exceed prospective net earnings.
- Poverty Trap
- A situation where an employed worker has little incentive to increase hours or gain promotion because extra earnings are lost to taxation and withdrawn means-tested benefits.
- Cyclical Unemployment
- Joblessness caused by an economy-wide shortfall in aggregate demand during an economic recession or cyclical downturn.
- Structural Unemployment
- Unemployment caused by a fundamental long-term mismatch between the skills or geographic location of jobseekers and the requirements of available jobs.
- Frictional Unemployment
- Temporary unemployment experienced by individuals who are between jobs, transitioning careers, or entering the workforce from education.
- Seasonal Unemployment
- Joblessness resulting from predictable, recurring calendar fluctuations in production or consumer demand, such as in tourism or agriculture.
- Classical Unemployment
- Unemployment caused when real wages are kept above the market-clearing equilibrium level by statutory minimum wage floors or collective bargaining.
- At Risk of Poverty
- An official relative income measure identifying people whose equivalised household disposable income falls below 60% of the national median.
- Enforced Deprivation
- The inability to afford at least two of the eleven basic items and activities on the CSO's official deprivation list due to lack of financial resources.
- Consistent Poverty
- The official Irish poverty metric identifying people who are simultaneously at risk of poverty (income < 60% of median) and experiencing enforced deprivation.
- In-Work Poverty
- A situation where an employed individual lives in a household experiencing poverty or enforced material deprivation despite earning wages.
- Working Family Payment (WFP)
- A tax-free, means-tested weekly payment made by the Irish state to low-income employees with dependent children.
Check yourself
State the three conditions required to be officially classified as unemployed under ILO criteria.
A person must be without work during the reference week, available to take up work within the next two weeks, and actively seeking work in the past four weeks.
Why is the Live Register not considered an accurate measure of official unemployment in Ireland?
It is an administrative count that includes casual and part-time workers who have jobs, while excluding jobless individuals who are not eligible for or choose not to claim social welfare.
Name the type of unemployment caused by the collapse of the domestic construction industry after 2008 and state one policy that targets it.
Structural unemployment. It is targeted through state-funded upskilling, retraining, and apprenticeship programmes (such as SOLAS or Springboard+) to equip workers for sectors with vacancies.
Explain the difference between the unemployment trap and the poverty trap.
The unemployment trap affects an unemployed person whose welfare benefits are close to potential net earnings, discouraging them from taking a job. The poverty trap affects an employed person whose extra earnings are clawed back by taxes and withdrawn benefits, discouraging them from increasing hours or seeking promotion.
Why does the Irish government pursue full employment? Give two distinct fiscal reasons.
1. It increases tax revenues (PAYE, USC, PRSI, VAT). 2. It reduces social protection expenditures (Jobseeker's Benefit and Allowance), freeing funds for capital investment.
What is the difference between being 'at risk of poverty' and being in 'consistent poverty' under CSO definitions?
'At risk of poverty' is strictly an income measure (living below 60% of median equivalised disposable income). 'Consistent poverty' requires being simultaneously at risk of poverty and experiencing enforced deprivation (lacking 2 or more basic essentials out of 11).