

In Section 2 you are given documents you have never seen before — usually two, often accompanied by a chart, table, or map — and asked to work with the evidence in them. Nothing in this section can be learned off by heart: you are marked on what you do with the material in front of you. Section 2 is worth 150 marks, which represents 30% of your total Leaving Certificate mark for the subject and 37.5% of the terminal written paper (150 out of 400 marks). It is the single biggest block of marks on the exam after the discursive essays. Three core skills carry the section: extracting and manipulating numbers accurately; judging how robust the research is and how far its conclusions can be trusted; and pulling qualitative and quantitative evidence together into a reasoned conclusion that draws on what you know from across the Politics and Society specification.
Section 2 Structure and the Five-Minute Setup
Section 2 presents unseen stimulus material, usually labelled Document A and Document B. These documents combine written texts with visual or numerical formats such as tables, bar charts, infographics, or thematic maps.
The questions move from lower to higher mark tariffs, and the longest synthesis question is normally last. However, the order of earlier parts varies from year to year — methodology critiques have appeared as early as part (a). Read every part before reading the stimulus so that you review the sources with purpose.
The Five-Minute Setup Routine
- Read all question prompts first to see which document each part addresses and where the marks are concentrated.
- On Document A and Document B, immediately underline the methodology sentence: who gathered the data, how, when, and from how many participants. This is where your methodology marks live.
- Circle every key number, its associated unit (e.g. percentage, rate per 1,000, euro), and its reference year.
- Mark in the margin of the examination paper whether each question requires Document A, Document B, both documents, or wider syllabus knowledge.
Quantitative Data Manipulation and Reading Visuals
Quantitative data represents social reality in numerical form. Common stimulus formats include national censuses, administrative records, and structured opinion polls. The specification's description of a high level of achievement in the written examination states that candidates 'accurately analyse and evaluate qualitative and quantitative data from different sources' and that 'manipulation of data, where appropriate, will be almost flawless'. Never transcribe raw figures without showing what they mean.
Essential Mathematical Calculations
- Percentage of a total:
- Percentage point difference: . Use this whenever subtracting one percentage from another.
- Relative percentage change:
- Rates per capita: (or per )
The Percentage Point Trap
If support for a policy moves from 20% to 25%, it has increased by 5 percentage points (). However, its relative percentage increase is 25%:
Conflating these two concepts is heavily penalised. Always state your units explicitly in your written answers.
Raw Totals Versus Rates
Raw figures can mislead when comparing populations of different sizes. If Region A records 300 hate crimes among 150,000 residents, its rate is per 1,000 residents. If Region B records 100 hate crimes among 25,000 residents, its rate is per 1,000. While Region A has three times as many total incidents, Region B has twice the rate of occurrence.
Reading Graphs, Bar Charts, and Maps
Before writing a conclusion from a visual stimulus, check five framing elements:
- Title and source: what is being measured and by whom?
- Units: are the axes showing absolute numbers, percentages, or rates?
- Time period: is the visual a single snapshot or a multi-year trend?
- Legend and categories: do bars represent distinct groups or can categories overlap?
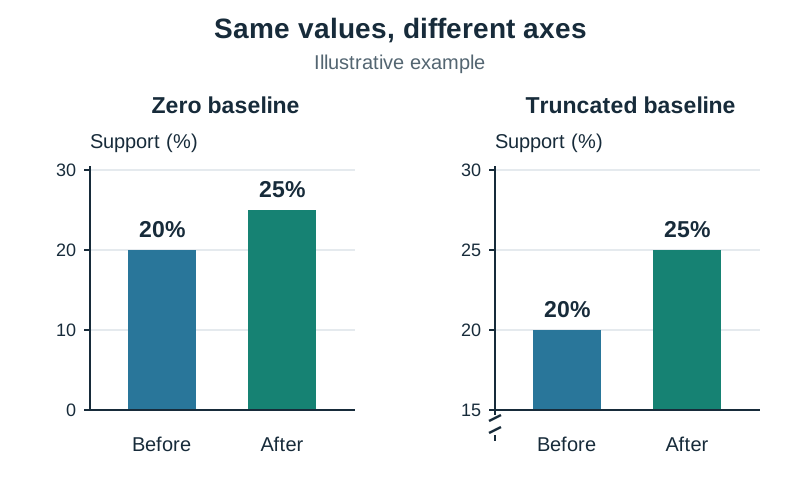
- Scale: does the axis start at zero? A truncated axis exaggerates minor variations. When comparing two maps or charts, check if they share identical scales.
When writing conclusions from visuals, use this formula: direction or pattern + exact figures with units + years or geographic distribution. For maps, evaluate concentration versus spread (for instance, showing that conflict displacement is concentrated in specific regions such as sub-Saharan Africa and the Middle East, whereas disaster displacement is geographically widespread across Asia and the Americas).
Qualitative Data and Research Methodologies
Qualitative data captures non-numerical evidence, exploring human experiences, motivations, beliefs, and social contexts. Typical sources include semi-structured interviews, focus groups, diary entries, personal testimonies, and observational field notes.
While quantitative data demonstrates the scale of an issue, qualitative data explains why people act or feel as they do. For instance, while a quantitative chart can reveal that minority voter turnout dropped by 14 percentage points, qualitative testimonies can uncover the underlying mechanisms, such as experiences of administrative exclusion, language barriers, or lack of trust in party platforms.
| Dimension | Quantitative Research | Qualitative Research |
|---|---|---|
| Focus | Measurement, breadth, and statistical trends | Meaning, depth, and lived experience |
| Core Strengths | High reliability, easily replicated, generalisable if representative | Rich context, puts a human face on statistics, captures nuanced emotion |
| Core Limitations | Inflexible questions, misses individual nuance, risks digital exclusion | Cannot be statistically generalised, subjective, impossible to replicate identically |
| Typical Exam Question | Calculate percentage change; draw two conclusions; critique sampling method | Critique the use of case studies or personal testimonies; explain what this adds to statistics |
Primary Data, Secondary Data, and Desk-Based Research
- Primary data: evidence gathered directly by researchers for the specific study (e.g. surveys, interviews, observations).
- Secondary data: existing material produced by someone else and re-analysed (e.g. census records, academic papers, NGO datasets).
- Desk-based research: gathering and reviewing existing published reports and archives without entering the field. Strengths include low cost and historical breadth; limitations include reliance on secondary source quality, incompatible definitions, and potentially outdated metrics.
Evaluating Research Methodologies and Source Credibility
Under Learning Outcome 4.4, you must seek and evaluate information received from traditional media, new media, and individuals in a reasoned way. Questions testing methodology regularly require a balanced evaluation of both strengths and limitations.
The Four Stages of Social Research
A research project moves through four stages:
- Design stage: Clarifying the research question and deciding on operationalisation — translating an abstract social concept (such as marginalisation or political efficacy) into an observable, measurable indicator. Researchers also choose sampling methods, selecting probability sampling for broad quantitative surveys or identifying a key informant for qualitative interviews.
- Data collection stage: Administering tools in the field (surveys, interviews, or observations). Weaknesses include poor question wording, low response rates, and interviewer bias.
- Data analysis stage: Collating evidence and testing patterns. A primary flaw here is confusing correlation with causation.
- Write-up stage: Presenting findings via text and charts while transparently acknowledging limitations, margins of error, and excluded groups.
Five Checks on Any Source
- Authorship and status: Statutory agencies (e.g. Central Statistics Office, Eurostat) operate under public accountability. Advocacy groups or think tanks may frame data selectively to support campaigns.
- Currency: Compare collection date against publication date. Old baseline data may miss significant policy reforms.
- Sampling method: Distinguish between the access panel and the completed sample. Check for self-selection bias in volunteer surveys or coverage bias where offline cohorts are omitted.
- Quota controls and weighting: Check whether researchers used quota sampling for age, gender, social class, and region, and applied weighting so completed samples reflect census distributions.
- Reporting gap and undercounting: Administrative data based on reported crimes frequently suffers from undercounting due to victim distrust or fear of reprisal.
Ethics in Sensitive Social Research
When evaluating research on sensitive issues such as domestic violence, discrimination, or displacement, a complete critique addresses ethics:
- Informed consent: Participants must understand the research purpose and participate freely without coercion.
- Anonymity and confidentiality: Identifying details must be protected or pseudonymised.
- Protection from harm: Minimising re-traumatisation by providing support services and explicit rights to withdraw.
- Special safeguards: Parental or guardian consent is mandatory for research involving participants under 18.
Argument Analysis, Emotive Language, and Concept Definitions
Learning Outcome 4.4 requires candidates to analyse the structure of arguments and assess how language influences judgement.
Deconstructing an Argument
Any argument within stimulus material can be separated into four core components:
- Conclusion: The central claim the author wants the reader to accept.
- Reasons: The evidence, logic, or empirical data offered in support of the conclusion.
- Assumptions: Unstated premises taken for granted without empirical proof. Identifying an unstated assumption is a high-scoring analytical skill.
- Counter-arguments: Opposing interpretations addressed or ignored by the author. A document that omits counter-arguments exhibits one-sided advocacy.
Analysing Emotive Language
Emotive language refers to words deliberately selected to provoke an affective reaction rather than communicate factual evidence (e.g. using 'flooded with migrants' rather than 'net inward migration increased', or describing spending changes as 'slashed' rather than 'reduced'). When addressing this in an exam: quote the specific word or phrase, identify the emotion it triggers (fear, indignation, outrage), and explain how it sidesteps empirical justification.
Fact, Opinion, and Reasoned Judgement
- Fact: An objective statement that can be verified as true or false using empirical evidence (for example: Under the Electoral (Amendment) (Political Funding) Act 2012, Irish political parties face financial penalties if they do not meet statutory candidate gender quotas).
- Opinion: A subjective personal belief or value statement that cannot be proven true or false (for example: Local politics is far too adversarial for young people).
- Reasoned judgement: A conclusion reached through the logical evaluation of factual evidence, acknowledging constraints and criteria (for example: Female representation in Dáil Éireann rose from 15% in 2011 to 22.2% in 2016, and reached 25% in 2024. Because this increase coincided with quota implementation and concentrated within funded parties, evidence supports the judgement that candidate quotas accelerated parliamentary gender balance, though party recruitment policies also contributed).
Answering 'Explain the Term as Used in the Document'
Use a precise three-sentence structure: define the concept in formal terms; explain how the document applies it; and cite an example from the text.
Cross-Document Synthesis, Tariff Scaling, and Course Thinkers
The final extended questions carry the highest marks in Section 2. Your answer structure must match the question's specific command words.
Scaling Answers to the Mark Tariff
- Low tariff (approx. 5 marks): 1–2 sentences giving a definition, single calculation with units, or two concise points.
- Middle tariff (approx. 10 marks): 3–4 developed points with balanced strengths and limitations.
- High tariff (approx. 20 marks): 5–6 developed points synthesising both documents, ending with an evaluative verdict.
- Highest tariff (approx. 30 marks): A comprehensive synthesis drawing on both documents, wider syllabus concepts, and named political theorists.
Two Extended Answer Structures
- For prompts asking 'What conclusions can you draw from both documents?' or 'What are the causes/impacts of...': Focus entirely on extracting distinct conclusions supported by cross-referencing both sources. Write 4 to 5 separate paragraphs: state the claim; cite specific statistics and units from Document A; corroborate or explain using testimonies from Document B; and state what the combined evidence proves and what remains unaddressed.
- For prompts asking you to 'Assess', 'Critically analyse', or 'To what extent': Use the P-T-D-O structure as a revision tool:
- Point: Open with a direct thematic claim addressing the prompt.
- Thinker or framework: Introduce a named syllabus theorist or international treaty to explain the structural cause.
- Data: Weave specific figures and quotes from Document A and Document B together.
- Overall judgement: Conclude with a reasoned evaluation that qualifies the strength of the evidence without writing unsupported personal opinions.
Theorists and Frameworks Matched to Data Contexts
The unseen data will focus on social and political issues across the course strands, most frequently touching on the four learning outcomes where evaluating unseen research is specified (2.5, 6.1, 7.5, and 8.2). However, Higher Level candidates are expected to draw on their wider knowledge across the entire course.
- Representation and Power (elections, quotas, media):
- Karl Marx: Economic class division and power under capitalism.
- Sylvia Walby: Six structures of patriarchy (paid work, state, culture, violence, household, sexuality).
- Kathleen Lynch: Affective equality; institutional failure to accommodate unpaid care work.
- Noam Chomsky: Media filters, ownership, and agenda-setting.
- Thomas Hobbes, John Locke, Robert Nozick: State authority, governance by consent, and property rights.
- Identity and Cultural Change (migration, diversity, integration):
- Benedict Anderson: Nations as imagined communities.
- Edward Said: Orientalism and Western construction of non-Western cultures as inferior.
- Samuel Huntington: Fundamental civilisational conflict.
- Kwame Anthony Appiah: Cosmopolitanism and fluid, multiple identities.
- Thomas Hylland Eriksen: Cultural mixing, hybridity, and non-static traditions.
- Sustainable Development and Global Justice (trade, climate, poverty):
- André Gunder Frank: Dependency theory and unequal terms of trade.
- Vandana Shiva: Ecofeminism; corporate enclosure and dispossession of traditional female environmental stewards.
- Seán McDonagh: Sustainable development in harmony with nature; small-scale renewable community economies.
- Human Rights Frameworks:
- UN Convention on the Rights of the Child (Articles 6, 12, 19, 31).
- European Convention on Human Rights (enforced via the European Court of Human Rights).
- UN Declaration on the Right to Development.
Key terms
- Quantitative Data
- Information gathered in numerical form that can be measured, counted, and statistically analysed, such as census records and survey percentages.
- Qualitative Data
- Non-numerical, descriptive information that captures lived experiences, words, and meanings through interviews, focus groups, or field observations.
- Operationalisation
- The process of translating an abstract political or sociological concept into a specific, observable, and measurable research indicator.
- Reliability
- The consistency and repeatability of a research instrument; whether repeating the study under identical conditions produces consistent results.
- Validity
- The extent to which a research study accurately measures the specific concept or phenomenon it set out to investigate.
- Generalisability
- The degree to which findings obtained from a specific research sample can legitimately be projected onto the wider target population.
- Percentage Point
- The arithmetic difference calculated by directly subtracting one percentage value from another.
- Relative Percentage Change
- The rate of change expressed proportionally to the original value, calculated as ((New Value - Original Value) / Original Value) * 100.
- Primary Data
- First-hand empirical evidence collected directly by the researcher for the specific requirements of their investigation.
- Secondary Data
- Existing information originally gathered by outside individuals or institutions and re-analysed for a new study.
- Desk-Based Research
- A research methodology that collects and reviews existing documents, statistics, and published materials without fieldwork.
- Self-Selection Bias
- A distortion occurring when participants volunteer to participate, skewing data toward individuals with strong views or surplus time.
- Coverage Bias
- A research limitation that occurs when sampling methods systematically exclude specific population segments, such as offline households in digital polls.
- Quota Sampling
- A non-probability sampling method where researchers recruit participants to reflect predetermined demographic proportions (e.g. age, gender, social class).
- Weighting
- A statistical procedure applied after data collection to adjust sample demographics to align with known national census benchmarks.
- Key Informant
- An individual selected for qualitative research due to their specialist expertise, professional role, or lived experience of an issue.
- Triangulation
- The practice of using multiple research methods, data sources, or theoretical perspectives to corroborate findings and increase validity.
- Undercounting
- The systematic under-recording of social issues in administrative data when incidents are not reported to or recorded by authorities.
- Reasoned Judgement
- A logical conclusion supported by factual evidence and clear evaluative criteria, distinguished from unbacked personal opinion.
- Emotive Language
- Words selected deliberately to evoke an emotional reaction in an audience to persuade them without providing empirical proof.
- Patriarchy
- A systemic social structure in which men hold primary power and predominate in roles of political leadership, authority, and social privilege.
- Affective Equality
- A concept developed by Kathleen Lynch emphasising that equality requires recognizing and redistributing emotional and unpaid care work.
Check yourself
What proportion of the written exam and total Leaving Certificate mark does Section 2 represent?
Section 2 accounts for 37.5% of the terminal written examination (150 out of 400 marks) and exactly 30% of your total Leaving Certificate grade (150 out of 500 marks).
If youth voter turnout moves from 40% to 50%, what is the percentage point change and what is the relative percentage increase?
The change is 10 percentage points (50 - 40 = 10), and the relative percentage increase is 25% (((50 - 40) / 40) * 100 = 25%).
Name and briefly describe the four stages of a social research project.
1. Design stage (operationalising concepts and choosing sampling); 2. Data collection stage (administering tools in the field); 3. Data analysis stage (collating data and testing patterns); 4. Write-up stage (presenting findings and acknowledging limitations).
What is meant by the research term 'operationalisation'?
Translating an abstract social or political concept into a specific, observable, and measurable indicator for research.
Why does a large sample recruited through social media fail to guarantee national representativeness?
It suffers from self-selection bias (attracting already engaged followers) and coverage bias (excluding those without digital access), while lacking quota controls and weighting.
Give two limitations of using media reports as your only source of data on a social issue.
Media coverage is not systematic, meaning cases in rural areas or regions with limited press freedom go unreported (causing undercounting); and researchers must judge categories from secondary media accounts alone, introducing researcher bias.
Why do official police crime statistics frequently undercount the true incidence of domestic violence or racism?
Administrative crime logs record only incidents that victims report and police formally register; fear of reprisal, shame, and institutional distrust leave many incidents unrecorded.
What threshold applies to candidate gender quotas under the Electoral (Amendment) (Political Funding) Act 2012, and to which elections does it apply?
Parties lose 50% of state funding unless at least 40% of their candidates are women and 40% are men (raised from 30% for general elections after May 2023). It applies exclusively to Dáil general elections.