

Data analysis means taking messy raw data, tidying it up, summarising it with a program, and using what you find to make a decision. In this topic you will learn to tell discrete data from continuous data, clean up raw records, and write your own Python code for frequency, mean, median and mode instead of calling a ready-made statistics function.
The Data Analysis Lifecycle and Data Ethics
Data analytics begins with defining a clear question or hypothesis, rather than simply gathering numbers at random. A hypothesis is a testable, falsifiable statement that predicts an outcome, such as: "Students who sleep more than eight hours achieve higher test scores."
Testing this statement follows an iterative design process:
- Investigate: Formulate the research question, identify the required variables, and consider ethics and data protection.
- Plan: Choose sources (sensors, public datasets, or surveys), define data formats, and select programming tools.
- Design: Plan algorithms using pseudocode or flowcharts to parse, clean, and summarise the records.
- Create: Implement algorithms in Python to transform the data, calculate descriptive statistics, and plot visualisations.
- Evaluate: Decide whether the data supports your hypothesis or not, and say what the limitations are (small sample, missing records, outliers).
- Document: Report the methodology, code, findings, and evidence-based decisions.
Collecting data responsibly
When gathering data about people, four principles are essential for examination questions on ethics:
- Consent: Inform participants about what data is collected and why, providing a clear opt-out. Consent must be freely given.
- Anonymisation: Strip out direct identifiers such as names, student numbers, or IP addresses so individuals cannot be identified from published summaries.
- Data minimisation: Collect only the fields strictly required to test your hypothesis. Gathering extra personal details introduces security risks without analytical value.
- Secure storage and retention: Store datasets on access-controlled systems and delete raw identifying records once analysis finishes.
Data Types: Discrete vs Continuous
Before processing data, you must identify its numerical nature:
- Discrete data: Consists of distinct, separate values obtained by counting. It can only take specific values with no intermediate fractions possible. Examples include attendance headcounts, goals scored in a match, or exam marks recorded only as whole numbers out of 100.
- Continuous data: Consists of values obtained by measurement along an unbroken scale. Examples include temperature readings, sprint times, battery voltages, or exam percentages calculated to decimals. A runner might finish in 12.4 seconds, 12.42 seconds, or 12.428 seconds depending on the timer precision.
Either data type can be grouped into class intervals and displayed on a histogram; grouping is a choice about visual presentation, not an inherent property of the underlying data type.
Because a computer stores everything as bits, it cannot hold a continuous measurement with unlimited precision: the value is sampled and rounded to the nearest value a float can hold.
High-level procedural languages use standard types to structure records:
| Data Type | Python Equivalent | Practical Use in Data Analysis |
|---|---|---|
| Boolean | bool | Binary flags (e.g. is_passing = True) |
| Integer | int | Discrete counts and list indices |
| Real | float | Continuous measurements and statistical averages |
| Character | str (length 1) | Single-character codes such as a grade letter 'A' or sex code 'M' |
| String | str | Text labels, names, and grade codes such as 'H1' |
| Array / List | list | Ordered sequences of observations |
When reading external text files, using UTF-8 ensures that international characters and Irish fadas (such as in 'Róisín') are preserved correctly.
Structuring and Cleansing Raw Records
Raw data usually arrives as lines of text from files or sensors, often separated by commas (a CSV file: comma-separated values). Preparing it involves reading the records, splitting fields, cleaning whitespace, validating entries, and casting data types.
Structuring raw records
Reading a CSV file requires three steps: read each line, split it into fields, and cast the required fields to numbers:
scores = []
names = []

file = open("results.txt", "r")
for line in file:
    line = line.strip()          # remove newline characters
    if line == "":               # skip empty lines
        continue
    fields = line.split(",")     # returns a list of fields
    names.append(fields[0])
    scores.append(int(fields[1]))
file.close()
Cleansing and validation
Data cleansing detects and removes corrupt, missing, or out-of-range data. Keep two validation checks distinct:
- Type check (is it a valid number?): For whole counts,
.isdigit()works. However,.isdigit()returnsFalsefor'21.5'and'-4', so use it only for non-negative integers. For continuous measurements or negative values, use atry...exceptblock. - Range check (is it a believable value?): Apply relational operators to enforce reasonable boundaries, such as
0 <= score <= 100.
raw_readings = ["21.5", " 19.8", "sensor_err", "-3.2", "", "150.0"]
clean_temps = []

for entry in raw_readings:
    entry = entry.strip()
    try:
        temp = float(entry)
        if -40.0 <= temp <= 60.0:    # range validation
            clean_temps.append(temp)
    except ValueError:               # type validation failed
        pass

print(clean_temps)  # [21.5, 19.8, -3.2]
Trace table for cleansing
| Iteration | entry | float(entry) | -40.0 <= temp <= 60.0 | clean_temps |
|---|---|---|---|---|
| 1 | "21.5" | 21.5 | True | [21.5] |
| 2 | " 19.8" | 19.8 | True | [21.5, 19.8] |
| 3 | "sensor_err" | ValueError | Skipped | [21.5, 19.8] |
| 4 | "-3.2" | -3.2 | True | [21.5, 19.8, -3.2] |
| 5 | "" | ValueError | Skipped | [21.5, 19.8, -3.2] |
| 6 | "150.0" | 150.0 | False (out of range) | [21.5, 19.8, -3.2] |
Statistical Algorithms from First Principles
The long programming question at the end of the paper regularly asks you to write statistics algorithms yourself, and may state that you may not use a ready-made library function. When an input dataset is empty, consistently print an error message and return None.
Pseudocode for arithmetic mean
Examiners frequently ask for algorithms in pseudocode rather than Python. Pseudocode is structured, plain English that uses indentation and formal constructs:
BEGIN FindMean
    INPUT dataset
    IF length of dataset = 0 THEN
        OUTPUT "Error: empty dataset"
        RETURN None
    END IF
    SET total TO 0
    FOR EACH value IN dataset
        SET total TO total + value
    END FOR
    SET mean TO total / length of dataset
    OUTPUT mean
END
Python implementation of mean
Always compute len(dataset) dynamically and avoid division by zero:
def calculate_mean(dataset):
    if len(dataset) == 0:
        print("Error: empty dataset")
        return None
    total = 0
    for item in dataset:
        total += item
    return round(total / len(dataset), 2)
Frequency and dictionaries
A dictionary stores key-value pairs. For frequency, each unique data element is a key and its count is the value:
def calculate_frequency(dataset):
    counts = {}
    for value in dataset:
        if value in counts:
            counts[value] += 1
        else:
            counts[value] = 1
    return counts
Tracing calculate_frequency([62, 88, 62]):
| Iteration | value | Is value already a key? | counts state |
|---|---|---|---|
| 1 | 62 | No | {62: 1} |
| 2 | 88 | No | {62: 1, 88: 1} |
| 3 | 62 | Yes | {62: 2, 88: 1} |
Mode
The mode is the most frequently occurring value. If no value repeats at all (the highest frequency is 1), we say there is no mode. If two or more values tie on the highest frequency, the data set has more than one mode (bimodal or multimodal) and the algorithm returns them all:
def calculate_mode(dataset):
    if len(dataset) == 0:
        print("Error: empty dataset")
        return None
    counts = calculate_frequency(dataset)
    max_freq = 0
    for val in counts:
        if counts[val] > max_freq:
            max_freq = counts[val]
    if max_freq <= 1:
        return []
    modes = []
    for val in counts:
        if counts[val] == max_freq:
            modes.append(val)
    return modes
Median and sorting without built-in functions
The median is the middle value of an ordered dataset. If .sort() is forbidden, sort the list using a bubble sort:
def bubble_sort(data):
    items = list(data)
    n = len(items)
    for i in range(n - 1):
        for j in range(n - 1 - i):
            if items[j] > items[j + 1]:
                items[j], items[j + 1] = items[j + 1], items[j]
    return items
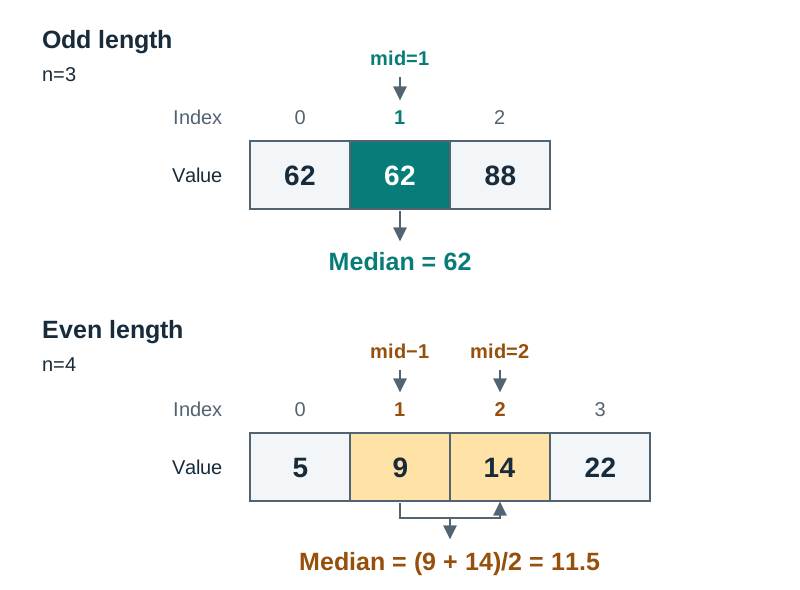
Once sorted, compute the midpoint index using integer division mid = len(dataset) // 2. If the length is odd (len % 2 != 0), the median is at dataset[mid]. If even, it is (dataset[mid - 1] + dataset[mid]) / 2.0.
Extremes and range
To find minimum and maximum without built-in functions, initialise both tracking variables to the first element:
def find_extremes(dataset):
    if len(dataset) == 0:
        return None, None
    lowest = dataset[0]
    highest = dataset[0]
    for val in dataset[1:]:
        if val < lowest:
            lowest = val
        if val > highest:
            highest = val
    return lowest, highest
Algorithmic efficiency
At Higher Level, you must compare algorithmic complexity:
- Finding the mean, frequency using a dictionary, or finding extremes each visit every item once: linear complexity, O(n).
- Finding the mode by comparing every item against all others with nested loops takes quadratic time, O(n²). The dictionary approach is O(n), making it vastly superior for large datasets.
- Finding the median is dominated by the sorting stage: bubble sort takes O(n²), while Python's internal Timsort takes O(n log n).
Visualising Data and Graph Selection
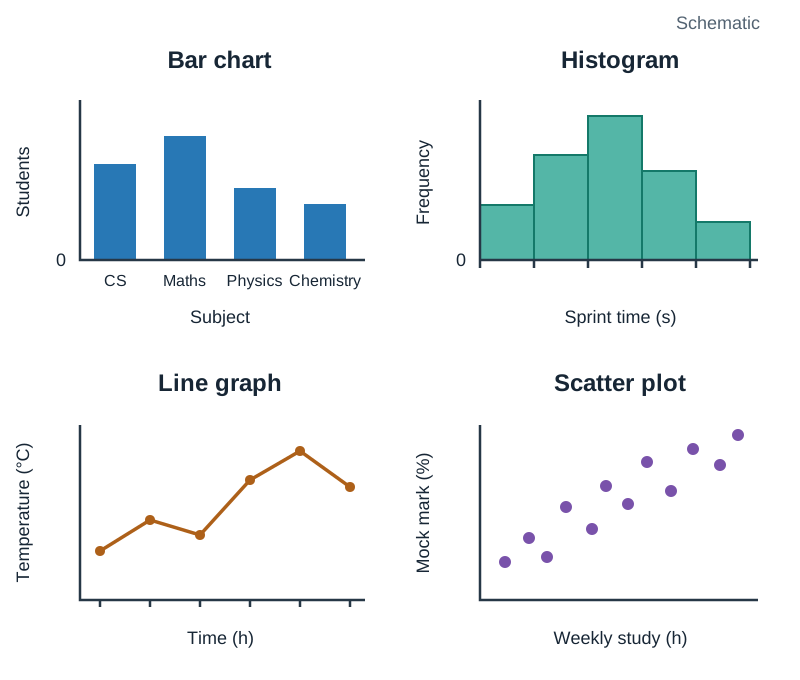
Choosing the correct graph format communicates patterns clearly and avoids misleading interpretations:
| Visualisation | Data Type & Purpose | Context Example |
|---|---|---|
| Bar chart | Discrete categories or counts; comparing distinct groups | Number of students enrolled in each Leaving Certificate option |
| Histogram | Continuous numerical data grouped into equal class intervals (bins) | Distribution of 100m sprint times grouped into 0.5-second bins |
| Line graph | Continuous variables recorded across sequential time intervals | Hourly temperature readings from an IoT weather sensor over 24 hours |
| Scatter plot | Investigating relationships or correlations between two paired variables | Comparing weekly study hours against mock examination percentages |
In Applied Learning Task 2 and coursework, matplotlib.pyplot is the standard tool for generating visualisations in Python:
import matplotlib.pyplot as plt

subjects = ['CS', 'Maths', 'Physics', 'Chemistry']
counts = [24, 31, 18, 14]

plt.bar(subjects, counts)
plt.title("Senior Cycle Subject Choice")
plt.xlabel("Subject")
plt.ylabel("Number of Students")
plt.show()
Questions on the written paper normally expect you to write the statistical algorithm yourself, and may state explicitly that you cannot use an imported library. matplotlib is used for practical projects and coursework rather than the pure-algorithm exam questions.
Rules for honest graphs
- Keep numerical baselines starting at zero on bar charts to avoid exaggerating small differences.
- Label both axes clearly, including units of measurement (e.g. seconds, metres, degrees Celsius).
- Maintain equal spacing across category bins on histograms.
Interpreting Results and Evidence-Based Decisions
Calculating summary statistics is only useful if you can explain what the numbers mean in context.
Outliers and measures of central tendency
An outlier is an extreme value that lies far away from the rest of the observations.
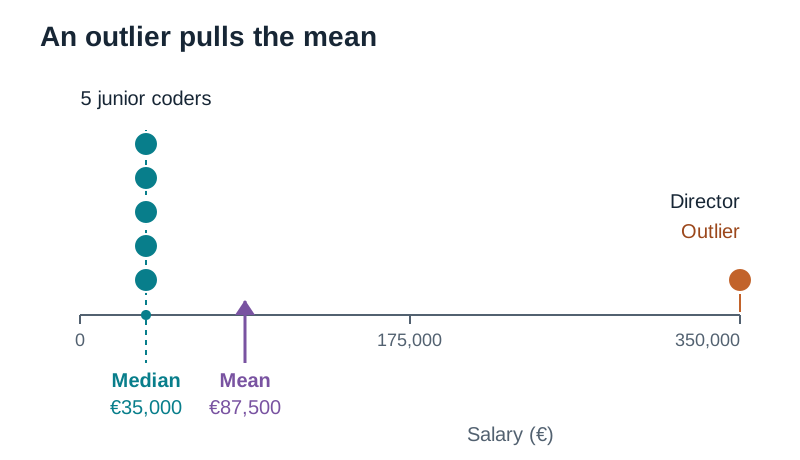
- The arithmetic mean uses every data point in its sum, which makes it sensitive to extreme values.
- The median depends only on the middle position, making it resistant to outliers.
For example, if five junior coders earn €35,000 each and the company director earns €350,000, the mean salary is €87,500. This figure does not represent any typical worker. The median is €35,000, which reflects the central reality of the workforce accurately.
Correlation versus causation
A correlation means two variables tend to change together, but it does not prove that one causes the other. A hidden third variable might influence both, or the connection could be pure coincidence.
Structuring evaluation answers
When an exam question asks you to evaluate analytical findings, structure your response in three parts:
- State what the figures show, quoting specific numerical results.
- Identify at least one limitation in the data (such as a small sample size, missing records, or confounding variables).
- State a justified, practical recommendation based directly on the evidence.
Key terms
- Analytics
- The systematic computational analysis of data to discover meaningful patterns and inform decision-making.
- Hypothesis
- A testable and falsifiable prediction that guides data collection and investigation.
- Discrete data
- Numerical values obtained by counting that can only take specific, distinct values.
- Continuous data
- Numerical values obtained by measurement that can take any value along an unbroken scale.
- Data cleansing
- The process of identifying, filtering, and correcting corrupt, incomplete, or invalid records in raw data.
- Frequency
- The number of times a particular value, category, or interval appears in a dataset.
- Arithmetic mean
- The measure of central tendency calculated by dividing the sum of all observations by the number of observations.
- Median
- The middle value in an ordered dataset that divides the higher half from the lower half.
- Mode
- The most frequently occurring value in a dataset; a dataset has no mode if no value repeats at all, while ties on the highest frequency produce multiple modes.
- Outlier
- An observation that lies an abnormal distance away from other values, distorting the arithmetic mean.
- Correlation
- A statistical link between two variables that does not by itself prove a cause-and-effect relationship.
- Histogram
- A graph of continuous numerical data grouped into equal class intervals with adjacent bars.
- UTF-8
- A variable-width character encoding standard that represents all Unicode characters and maintains ASCII compatibility.
Check yourself
State whether student exam percentages calculated to one decimal place are discrete or continuous data, and explain why.
They are continuous data because they are measured along a numerical scale that includes decimal fractions, rather than being restricted to whole-number counts.
What is the median of the list [8, 2, 11, 4]?
First sort the list to get [2, 4, 8, 11]. Because the length is 4 (even), average the two middle values at indices 1 and 2: (4 + 8) / 2 = 6.0.
Why should a function calculating the arithmetic mean check if len(numbers) == 0 before dividing?
To prevent an unhandled ZeroDivisionError crash, allowing the program to return None or output a clear error message instead.
Write the line of Python code that separates the record "Murphy,17,62" into a list of three distinct fields.
fields = record.split(",") which produces ['Murphy', '17', '62'].
What does calculate_mode([4, 7, 1, 9]) return using the convention above, and why?
It returns an empty list [] because the highest frequency is 1; no value repeats, so there is no mode.
Why does sorting ['10', '2', '35'] in Python produce ['10', '2', '35'] instead of numerical order?
The values are strings, so Python compares them character by character using ASCII/Unicode values; '1' comes before '2' and '3'.
Why is the median preferred over the mean when reporting national household incomes?
Incomes are skewed by a tiny group of multi-millionaires (extreme outliers), which drags the mean upward; the median reflects the true middle earner.