

Photosynthesis is the process by which green plants make their own food using sunlight. Chlorophyll inside leaf cells absorbs light energy and uses it to turn simple raw materials from the air and soil into energy-rich sugars. The plant keeps the sugars for growth and cellular energy and releases oxygen into the air. Photosynthesis is the process by which plants (and algae and some bacteria) use light energy, trapped by chlorophyll, to convert carbon dioxide and water into carbohydrate (glucose), with oxygen released as a by-product.
Anabolic Nature, Chemical Equation, and Ecological Role
Metabolism includes every chemical reaction taking place inside a living organism. Anabolic reactions build large, complex molecules from smaller ones and require an input of energy. Catabolic reactions break large molecules down into simpler ones and release energy. Photosynthesis is an anabolic pathway because it uses light energy to assemble simple inorganic molecules—carbon dioxide and water—into the energy-dense six-carbon sugar glucose.
The balanced chemical equation is:
Make sure the equation balances on both sides: six molecules of carbon dioxide and six of water yield one molecule of glucose and six of oxygen. Light energy drives the reaction and chlorophyll absorbs that light. Because neither is consumed as a chemical reactant, write both above and below the arrow.
Plants take in and allocate these substances through specific routes:
- Carbon dioxide (reactant): Diffuses from the atmosphere into leaf mesophyll cells through microscopic pores called stomata. In submerged aquatic plants, dissolved inorganic carbon diffuses straight across leaf surfaces.
- Water (reactant): Absorbed from the soil by root hair cells through osmosis and transported upwards through xylem vessels to photosynthetic tissue. Water provides the hydrogen ions (protons) and electrons needed to build sugars.
- Glucose (product): The primary hexose sugar formed. Plant cells use glucose in respiration, convert it into sucrose for transport in phloem, or condense it into starch for storage and cellulose for structural cell walls.
- Oxygen (product): Derived entirely from the splitting (photolysis) of water, never from carbon dioxide. The plant uses some internally for aerobic respiration in its mitochondria, and the rest diffuses out through stomata into the surrounding air.
The Bridge to Respiration and the Carbon Sink
Respiration is the catabolic counterpart of photosynthesis. It breaks glucose down and releases energy as ATP, taking place mainly in the mitochondrion, whereas photosynthesis takes place in the chloroplast. Photosynthesis removes carbon dioxide from the air, acting as a carbon sink; respiration and combustion return carbon dioxide to the air. In the global carbon cycle, photosynthesis locks atmospheric into carbohydrate biomass, feeding passes that carbon along food chains, and cellular respiration and decay release it back into the atmosphere.
Chloroplast Architecture and Structural Adaptations
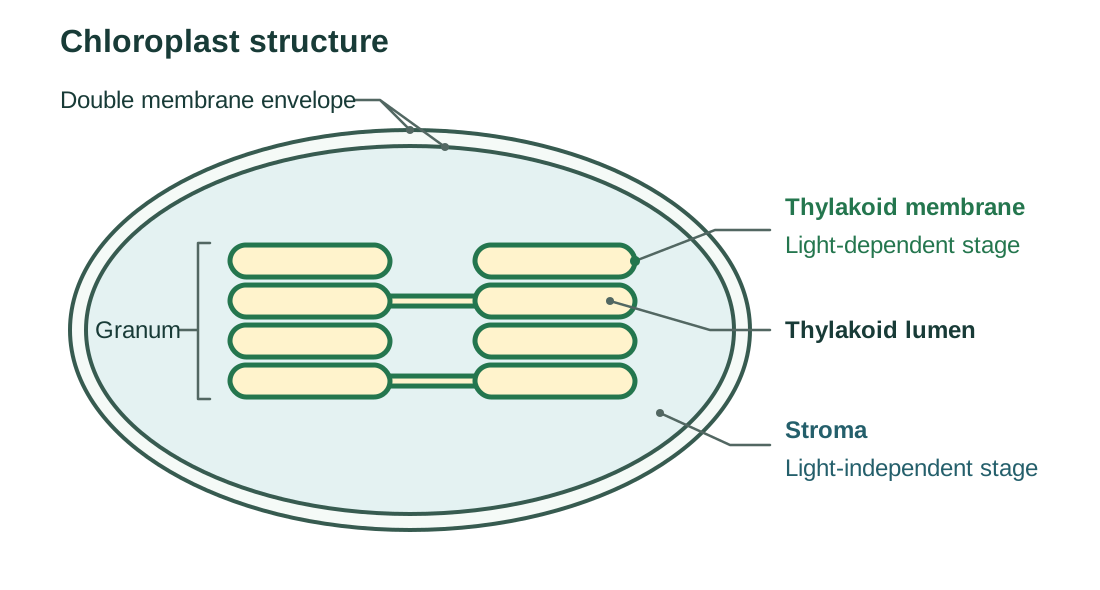
In plant cells, photosynthesis takes place inside the chloroplast, a double-membrane organelle found in large numbers inside palisade mesophyll cells. Structure-and-function answers score best when you give four things in order: name the part, say where it is, say what it does, and say which stage of photosynthesis it serves.
| Part | Location | Function | Process Connection |
|---|---|---|---|
| Double Membrane Envelope | Outer boundary of the chloroplast | Regulates the entry and exit of molecules, ions, and carrier coenzymes | Isolates photosynthetic reactions from the cytoplasm |
| Thylakoid Membrane | Network of flattened membrane discs running through the chloroplast | Houses photosynthetic pigments, electron transport chains, and ATP synthase | Provides a large surface area for the light-dependent stage |
| Granum (plural: Grana) | Stack of individual thylakoid discs | Holds photosystems and carrier proteins in close contact | Maximises photon absorption during the light-dependent stage |
| Thylakoid Lumen | Enclosed fluid space inside each thylakoid disc | Accumulates hydrogen ions (protons, ) from photolysis and proton pumps | Holds a steep proton concentration gradient for ATP synthesis |
| Stroma | Fluid matrix surrounding the grana inside the inner envelope | Contains soluble enzymes, dissolved carbon dioxide, ribosomes, and circular DNA | Site of carbon dioxide fixation in the light-independent stage |
Labelled Chloroplast Diagrams in Exams
If an exam question asks you to draw and label a chloroplast, include and label four essential features:
- The double membrane (outer boundary).
- A granum (a clear stack of disc-shaped thylakoids).
- The thylakoid membrane (the site of the light-dependent stage).
- The stroma (the fluid region around the grana, site of the light-independent stage).
When a question provides a diagram and asks where a particular reaction occurs, name the specific internal compartment rather than just stating 'in the chloroplast':
- Light-dependent stage thylakoid membrane or grana.
- Light-independent stage stroma.
Transfer Molecules: ATP and NADPH
The two stages of photosynthesis do not happen in isolation. They communicate through chemical transfer molecules that carry energy, electrons, and protons back and forth between the thylakoid membranes and the stroma.
1. Adenosine Triphosphate (ATP) – Energy Transfer
- Synthesis: Formed on the stromal surface of the thylakoid membrane by the enzyme ATP synthase. Energy released by electron movement drives the addition of an inorganic phosphate () to adenosine diphosphate (ADP):
- Role: ATP carries chemical bond energy from the thylakoids into the stroma. During the light-independent stage, ATP breaks down back into ADP and , supplying the activation energy needed to reduce carbon dioxide into glucose.
2. Nicotinamide Adenine Dinucleotide Phosphate (NADPH) – Reducing Power
- Synthesis: Formed at the end of the non-cyclic electron transport chain on the stromal face of the thylakoid. The carrier molecule accepts two energised electrons and one stromal proton ():
- Role: NADPH acts as a mobile biological reducing agent. It delivers high-energy electrons and hydrogen protons directly to intermediate carbon compounds in the stroma to build glucose.
ATP and NADPH act as recyclable transfer shuttles. They pick up energy and reducing power during the light-dependent stage, spend them to synthesise glucose in the stroma, and return to the thylakoids as ADP, , and to be recharged. Keep their roles clearly separated: ATP supplies chemical energy; NADPH supplies reducing power (electrons and protons).
The Light-Dependent Stage: Cyclic and Non-Cyclic Pathways
The light-dependent stage takes place on the thylakoid membranes and requires light. Photosynthetic pigments, including chlorophyll , chlorophyll , and carotenoids, act as light-harvesting clusters. Chlorophyll absorbs mainly blue and red wavelengths of light and reflects green light, which is why leaves appear green. These pigments pass their absorbed excitation energy along until it hits a specialised reaction centre chlorophyll molecule, which releases high-energy electrons.
Non-Cyclic Pathway
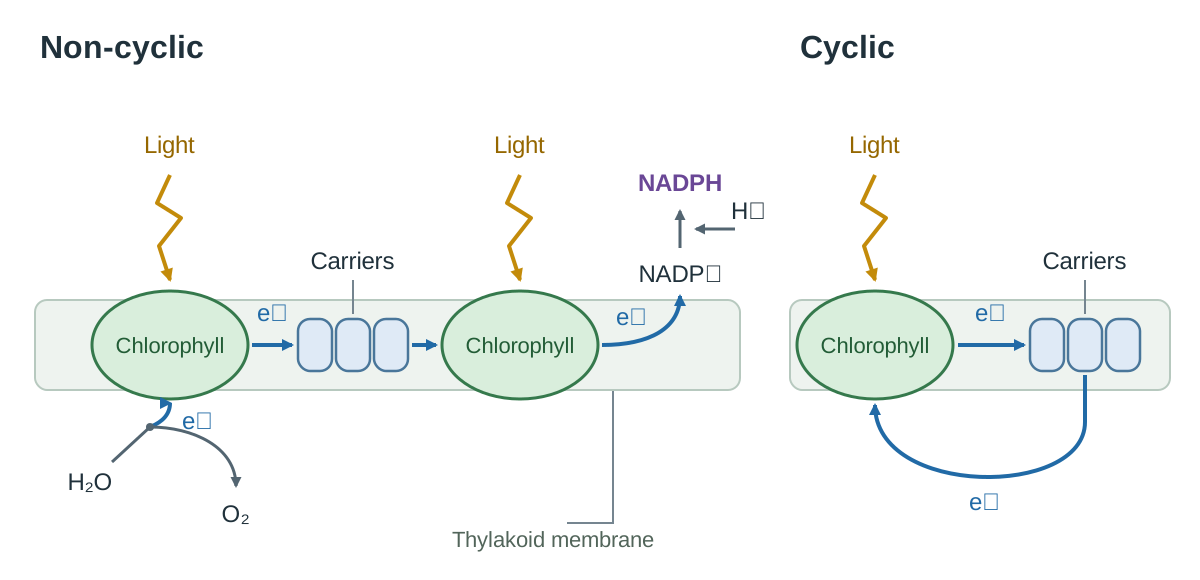
The non-cyclic pathway is an open, one-way flow of electrons that generates ATP, NADPH, and oxygen gas:
- Photon absorption and electron emission: Light hits the pigment cluster, energising electrons in the reaction centre chlorophyll. High-energy electrons escape to an electron acceptor in the thylakoid membrane.
- Photolysis of water: Having lost electrons, the reaction centre chlorophyll is positively charged, and this attracts electrons from nearby water molecules, splitting the water (photolysis) on the lumen side of the thylakoid membrane:
- These electrons replace those lost by the reaction centre chlorophyll.
- The (protons) accumulate in the thylakoid lumen, increasing the proton gradient.
- Oxygen gas () is released as a by-product.
- Electron transport chain and ATP production: The emitted high-energy electrons pass along a series of electron carrier proteins in the thylakoid membrane. As the electrons lose energy along the chain, that energy is used to pump protons from the stroma into the thylakoid lumen. The resulting proton gradient powers the formation of ATP by chemiosmosis.
- Formation of NADPH: The electrons are re-energised by light absorbed at a second chlorophyll reaction centre before being passed to . On the stromal surface, combines with two electrons and a proton from the stroma to form reduced NADPH.
Because the electrons originate from water, travel down the transport chain, and end up in NADPH, they never return to their original chlorophyll molecule. This is why the pathway is called non-cyclic.
Cyclic Pathway
When the chloroplast has plenty of NADPH but needs additional ATP to keep the light-independent stage running, it uses cyclic electron flow:
- High-energy electrons emitted by reaction centre chlorophyll pass through electron transport carriers in the thylakoid membrane.
- The energy they shed as they move down the carrier chain pumps protons into the lumen to fuel chemiosmotic ATP synthesis.
- Instead of being accepted by , the de-energised electrons return directly to the chlorophyll molecule they left.
- The cyclic pathway produces ATP only. It involves no photolysis of water, releases no oxygen, and forms no NADPH.
Some exam papers label the pathways on a diagram as pathway 1 and pathway 2. Do not memorise numbers, because different questions number them differently. Identify them by the electron path: if the electrons return to chlorophyll, it is cyclic; if they pass to and do not return, it is non-cyclic.
| Operational Feature | Non-Cyclic Pathway | Cyclic Pathway |
|---|---|---|
| Electron Flow Pattern | Unidirectional: Water Chlorophyll Transport Chain | Circular: Chlorophyll Transport Chain Returns to Chlorophyll |
| Photolysis of Water | Occurs () | Does not occur |
| Oxygen Released | Yes (released as a by-product) | No |
| ATP Synthesised | Yes (via chemiosmosis) | Yes (via chemiosmosis) |
| NADPH Formed | Yes (reduction of ) | No |
Chemiosmotic ATP Synthesis and the Proton Gradient
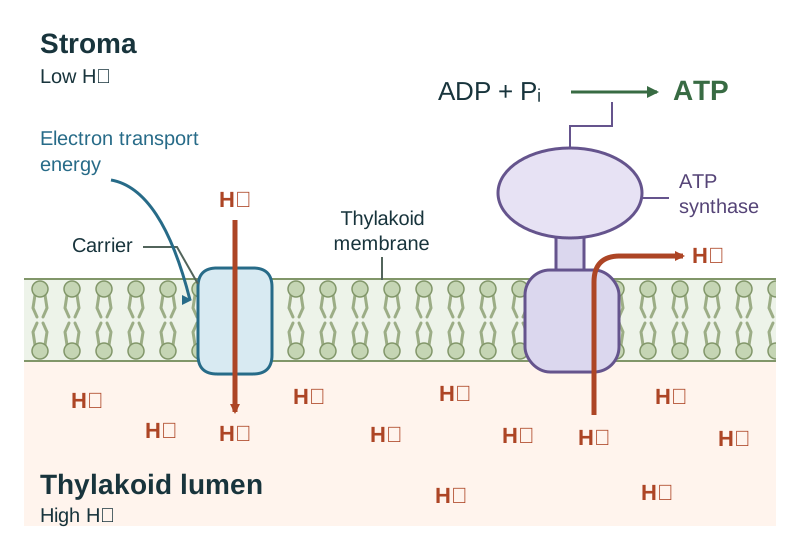
ATP synthesis in chloroplasts occurs by chemiosmosis, driven by an electrochemical proton gradient across the thylakoid membrane.
Protons accumulate inside the thylakoid lumen through two simultaneous events: they are pumped in from the stroma by carrier proteins using energy released by electron transport, and they are released directly into the lumen when water is split during photolysis. At the same time, protons in the stroma are consumed to make NADPH. This produces a much higher concentration of protons inside the lumen than out in the stroma.
The hydrophobic phospholipid bilayer is impermeable to ions, so protons cannot diffuse back into the stroma through the membrane lipids. They can only cross through the channel of the enzyme ATP synthase.
Protons flow down their electrochemical concentration gradient through ATP synthase from the thylakoid lumen out into the stroma. ATP synthase uses the kinetic energy of this proton flow to combine ADP and inorganic phosphate on its stromal face:
Because the catalytic head of ATP synthase faces outward, freshly formed ATP is released straight into the stroma, exactly where it is needed to power the light-independent reactions.
The Light-Independent Stage
The light-independent stage (often called the Calvin cycle) takes place in the liquid stroma of the chloroplast. It does not use light directly, but it relies on the supply of ATP and NADPH from the light-dependent stage. If light is turned off, this stage stops within seconds once the stroma runs out of short-lived ATP and NADPH.
The stage proceeds in three key steps:
- Carbon Dioxide Fixation: Atmospheric diffuses into the stroma and combines with an existing five-carbon acceptor molecule, forming unstable three-carbon compounds.
- Carbon Reduction: These three-carbon compounds are reduced into simple sugars. The transfer molecule NADPH donates high-energy electrons and protons (). The transfer molecule ATP breaks down into ADP and , supplying the chemical energy to drive the reduction.
- Carbohydrate Assembly and Acceptor Regeneration: Condensation reactions combine the reduced three-carbon units into glucose (). Additional ATP is used to regenerate the original five-carbon acceptor molecules so the cycle can continue.
After releasing their energy and reducing power, the spent molecules—ADP, , and —diffuse back to the thylakoid membranes to be recharged during the light-dependent reactions.
Limiting Factors: Light, Carbon Dioxide, and Temperature
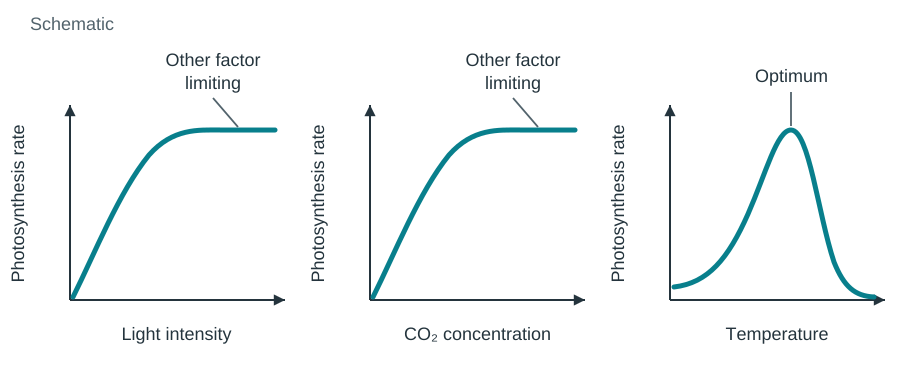
A limiting factor is an environmental condition that is in the shortest supply and directly restricts the rate of a physiological process. In photosynthesis, the rate is held back by whichever of three external factors is furthest from its optimum: light intensity, carbon dioxide concentration, or temperature.
1. Light Intensity
Light supplies the energy that excites electrons and splits water in the light-dependent stage. At low light intensities the rate rises steeply, and roughly in step with the increase in light, because light is the limiting factor. As light intensity increases further, the rate levels off into a plateau. At this saturation point, the chlorophyll molecules are absorbing photons as fast as they can, and either carbon dioxide supply or stromal enzyme activity has become the new limiting factor.
2. Carbon Dioxide Concentration
Carbon dioxide provides the carbon and oxygen atoms needed to build glucose in the stroma. Normal air contains only about 0.04% , so carbon dioxide is the most common limiting factor in outdoor crop growth. Increasing concentration accelerates the rate of photosynthesis until the rate levels off. At that point, the enzyme active sites fixing are saturated with substrate, or light intensity or temperature has become limiting.
3. Temperature
While photon absorption itself is not affected by temperature, the light-independent stage is controlled entirely by enzymes dissolved in the stroma. Photosynthetic rate against temperature produces a characteristic bell-shaped curve:
- Below the optimum (0 °C to ~30 °C): Warming gives molecules more kinetic energy, causing more collisions between enzyme active sites and substrate molecules per second, which increases the rate.
- Above the optimum (~35 °C to 40 °C): Excessive heat disrupts the hydrogen bonds holding the three-dimensional protein structure together. The enzyme undergoes denaturation, the active site loses its shape and can no longer bind substrate, and the rate drops sharply towards zero.
Investigating Photosynthesis Rate: Experimental Set Pieces
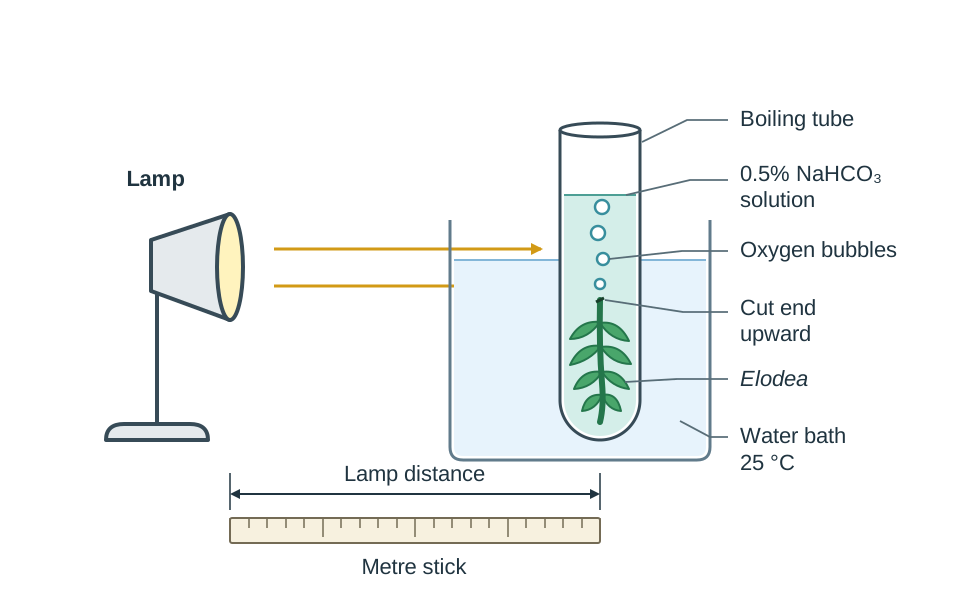
You investigate the rate of photosynthesis using an aquatic plant like Elodea (Canadian pondweed) submerged in water. As photosynthesis proceeds, oxygen gas collects and escapes from the cut end of the stem as bubbles. Because oxygen is slightly soluble in water, and because the plant also uses some oxygen in respiration, the bubble count slightly underestimates the true rate of photosynthesis. Even so, it provides a reliable, direct proxy for measuring the rate.
General Setup, Bench Craft, and Safety
- Stem preparation: Cut about 1 cm off the end of the stem with a sharp scissors or scalpel so that gas can escape freely from the cut surface, and place the shoot in the boiling tube with the cut end uppermost so the bubbles rise where you can count or collect them. Use a freshly cut, healthy shoot, because a shoot that has been standing for a long time bubbles slowly.
- Equilibration: Allow 5 minutes of equilibration time whenever you change a condition before recording data, so the plant adjusts to the new environment.
- Safety: Keep the electric lamp and its power lead away from water and wet benches. Handle hot water baths with care and do not heat them above 50 °C. Wash hands after handling pondweed and pond water.
Set Piece 1: Investigating the Effect of Light Intensity
- Purpose/Hypothesis: To investigate the effect of light intensity on the rate of photosynthesis in Elodea. Hypothesis: As light intensity increases, the rate of photosynthesis increases until another factor becomes limiting.
- Apparatus: Boiling tube, healthy Elodea shoot, metre stick, lamp (preferably LED), water bath at 25 °C, sodium hydrogen carbonate (), stopwatch.
- Method:
- Place the freshly cut Elodea shoot (cut end pointing up) into a boiling tube filled with 0.5% solution.
- Stand the boiling tube inside a water bath maintained at 25 °C.
- Position the lamp 50 cm away from the tube using a metre stick.
- Allow 5 minutes of equilibration time.
- Count the number of bubbles emerging from the cut stem over a 2-minute period. Repeat two more times and calculate the mean rate (bubbles per minute).
- Repeat the procedure at 40 cm, 30 cm, 20 cm, and 10 cm.
- Variables kept constant: Temperature (held at 25 °C by the water bath, preventing lamp heat from changing the water temperature); carbon dioxide supply (excess 0.5% ensures is never limiting); same plant shoot; same 2-minute counting window.
- Control: Set up an identical boiling tube with water and 0.5% but no pondweed (or containing a boiled and cooled shoot) beside the test tube under the same lamp and water bath. Why: No bubbles are produced in the control, proving that the bubbles in the test setup come from the living photosynthesising plant and not from warming of the liquid or chemical breakdown.
- Result: As the lamp moves closer, the bubble count per minute increases steeply at first, then levels off into a plateau.
- Conclusion: Light intensity increases the rate of photosynthesis up to a point, after which another factor becomes limiting.
Set Piece 2: Investigating the Effect of Temperature
- Purpose/Hypothesis: To investigate the effect of temperature on the rate of photosynthesis in Elodea. Hypothesis: The rate of photosynthesis will increase with temperature up to an optimum and then drop as enzymes denature.
- Apparatus: Boiling tube, Elodea shoot, water baths set at 10 °C, 20 °C, 30 °C, 40 °C, and 50 °C, lamp at a fixed distance (e.g. 20 cm), 0.5% , thermometer, stopwatch.
- Method:
- Place the cut Elodea shoot in a boiling tube containing 0.5% solution.
- Place the tube in the 10 °C water bath and position the lamp at exactly 20 cm.
- Allow 5 minutes for the plant and water to equilibrate to 10 °C.
- Count the bubbles released over 2 minutes, repeating three times to find the mean rate.
- Move the tube sequentially through water baths at 20 °C, 30 °C, 40 °C, and 50 °C, allowing 5 minutes of equilibration time at each temperature before counting.
- Variables kept constant: Light intensity (lamp kept at a fixed 20 cm distance); concentration (excess 0.5% throughout); same Elodea shoot.
- Control: A second tube containing 0.5% with no plant in the same water bath. No bubbles are produced at any temperature, confirming that gas bubbles are not simply dissolved air driven out of solution by heat.
- Result: Bubble rate rises from 10 °C to an optimum around 30 °C–35 °C, then falls sharply at 40 °C and stops by 50 °C.
- Conclusion: Photosynthesis is an enzyme-controlled process that has an optimum temperature; rates decrease above the optimum because the enzymes of the light-independent stage undergo denaturation.
Set Piece 3: Investigating the Effect of Carbon Dioxide Concentration
- Purpose/Hypothesis: To investigate the effect of carbon dioxide concentration on the rate of photosynthesis in Elodea. Hypothesis: Increasing carbon dioxide concentration will increase the rate of photosynthesis until the system becomes light- or temperature-limited.
- Apparatus: Boiling tube, Elodea shoot, serial dilutions of sodium hydrogen carbonate solution (0.01%, 0.05%, 0.1%, 0.5%, 1.0%), lamp at fixed distance (20 cm), water bath at 25 °C, stopwatch.
- Method:
- Place the Elodea shoot in the tube containing the lowest concentration of (0.01%).
- Stand the tube in the water bath at 25 °C with the lamp at a fixed distance of 20 cm.
- Allow 5 minutes of equilibration.
- Count bubbles released over 2 minutes, doing three trials to get a mean rate.
- Replace the solution with the next concentration of , equilibrate for 5 minutes, and record counts. Repeat for all concentrations up to 1.0%.
- Variables kept constant: Light intensity (lamp at fixed 20 cm distance); temperature (water bath at 25 °C); same plant shoot.
- Control: A tube of 1.0% solution without pondweed placed in the same water bath under the lamp. No bubbles appear, showing that the chemical solution does not produce bubbles on its own.
- Result: The bubble rate rises steadily with increasing concentration and then flattens out.
- Conclusion: Carbon dioxide concentration affects the rate of photosynthesis; above a certain concentration, carbon dioxide is no longer the limiting factor.
Working with Data and Evaluating Evidence
Practical questions regularly provide experimental data tables and require you to calculate rates, identify anomalies, describe graphs, and distinguish key terms relating to scientific inquiry.
Worked Data Example
A student counted oxygen bubbles released by an Elodea shoot over 2-minute periods at four lamp distances. Temperature (25 °C) and carbon dioxide concentration (0.5% ) were kept constant.
| Distance (cm) | Trial 1 | Trial 2 | Trial 3 | Mean (per 2 min) | Rate (bubbles ) |
|---|---|---|---|---|---|
| 10 | 44 | 46 | 42 | 44 | 22.0 |
| 20 | 24 | 22 | 23 | 23 | 11.5 |
| 30 | 12 | 13 | 11 | 12 | 6.0 |
| 40 | 8 | 20 | 7 | 7.5* | 3.75 |
- Calculating Rate: Divide the mean bubble count by the time period. At 20 cm: .
- Handling Anomalies: The reading of 20 in Trial 2 at 40 cm is an anomalous result. It does not fit the pattern established by the other trials and was likely caused by a counting error or a dislodged bubble. It must be excluded from the mean: , giving .
- Graph Description: When plotting rate on the y-axis against lamp distance on the x-axis, the rate falls as distance increases. If rate is plotted against light intensity (), the line rises steeply from zero, then levels off into a plateau when light is no longer limiting.
Evaluating Experimental Quality
- Accuracy: How close a measurement is to the true value. Collecting oxygen in a graduated micro-burette or gas syringe is more accurate than counting bubbles, because bubbles vary in size and volume.
- Precision: How close repeated measurements are to each other, regardless of whether they match the true value. For example, three bubble counts at 20 cm of 22, 23, and 24 show high precision.
- Repeatability: The ability of the same investigator to run the experiment again using the same equipment and obtain concordant results.
- Reproducibility: The ability of a different investigator in another laboratory using different apparatus to reach the same experimental conclusions.
- Random Error: Unpredictable variations, such as slightly miscounting bubbles or viewing a timer at an angle. Reduced by performing multiple trials and calculating an arithmetic mean.
- Systematic Error: A flaw in the equipment or method that pushes all measurements in one direction. For example, using a filament lamp that warms the tube as it moves closer introduces a systematic temperature increase; using a transparent heat shield or an LED lamp prevents this.
Key terms
- Photosynthesis
- The process by which plants use light energy, trapped by chlorophyll, to convert carbon dioxide and water into carbohydrate (glucose), with oxygen released as a by-product.
- Anabolic Reaction
- A biochemical reaction that builds large, complex molecules from smaller ones and requires an input of energy.
- Carbon Sink
- A natural reservoir, such as a forest, peat bog, or ocean biomass, that absorbs and stores more carbon dioxide from the atmosphere than it releases.
- Thylakoid Membrane
- An internal, disc-shaped membrane in chloroplasts that contains photosynthetic pigments, electron transport chains, and ATP synthase.
- Stroma
- The fluid-filled space within the chloroplast surrounding the grana where the light-independent reactions take place.
- Photolysis
- The light-driven splitting of water into protons, electrons, and oxygen gas at an oxidised reaction centre chlorophyll molecule.
- Non-Cyclic Photophosphorylation
- The one-way flow of light-energised electrons from water through an electron transport chain to NADP+, generating ATP, NADPH, and oxygen.
- Cyclic Photophosphorylation
- A light-driven pathway where energised electrons leave chlorophyll, pass through an electron transport chain to produce ATP, and return directly to chlorophyll without forming NADPH or oxygen.
- Chemiosmosis
- The synthesis of ATP driven by the movement of protons down their electrochemical concentration gradient across a membrane through ATP synthase.
- ATP Synthase
- A membrane-spanning enzyme channel that uses the flow of protons across a membrane to phosphorylate ADP into ATP.
- NADPH
- A reduced coenzyme that acts as a mobile carrier, supplying high-energy electrons and hydrogen protons to reduce carbon dioxide into glucose.
- Limiting Factor
- An environmental condition that is in the shortest supply and directly restricts the rate of a physiological process.
- Denaturation
- The permanent loss of an enzyme's three-dimensional shape caused by high temperature or extreme pH, preventing the active site from binding substrate.
- Accuracy
- How close an experimental measurement is to the true or accepted biological value.
- Precision
- How close independent repeated measurements of the same quantity are to each other.
Check yourself
Give the word-perfect definition of photosynthesis.
Photosynthesis is the process by which plants (and algae and some bacteria) use light energy, trapped by chlorophyll, to convert carbon dioxide and water into carbohydrate (glucose), with oxygen released as a by-product.
What is the exact cellular origin of the oxygen gas released during photosynthesis?
It comes from the photolysis (splitting) of water on the inner (lumen) side of the thylakoid membrane during the light-dependent stage.
How do cyclic and non-cyclic electron pathways differ in terms of electron movement alone?
In the cyclic pathway, electrons leave chlorophyll and return to chlorophyll; in the non-cyclic pathway, electrons leave chlorophyll, pass to NADP+, and do not return.
What are the two chemical products of the light-dependent stage that enter the stroma to drive the light-independent stage?
ATP (supplying chemical energy) and NADPH (supplying reducing power via electrons and protons).
In what direction do protons flow through chloroplast ATP synthase during chemiosmosis?
From the thylakoid lumen out into the stroma down their electrochemical concentration gradient.
In a light intensity investigation using Elodea, what setup serves as a control and what result is expected from it?
An identical tube containing water and sodium hydrogen carbonate but no pondweed (or containing a boiled and cooled shoot) under the same lamp and water bath; no bubbles are produced, proving that the gas bubbles come from the living photosynthesising plant.
A student moves a filament lamp closer to an Elodea tube to increase light intensity. Name one variable that is not properly controlled and explain how to fix it.
Temperature is not controlled because heat from the lamp warms the water as it moves closer; place a beaker of water between the lamp and tube as a heat shield (or use an LED lamp) and keep the tube in a thermostatically controlled water bath.
Why does the rate of photosynthesis level off when light intensity is increased beyond the saturation point?
Light intensity is no longer the limiting factor; another variable, such as carbon dioxide concentration or the turnover speed of stromal enzymes, has become limiting.