

Ecology is the study of how living organisms interact with one another and with their physical and chemical environment. This topic explores biological organisation from local habitats to the global biosphere, the one-way flow of energy through trophic levels, population dynamics and carrying capacity in Irish ecosystems, ecological niches and species interactions, methods for conducting habitat investigations in the field, and the measurement and conservation of biodiversity.
Levels of Ecological Organisation and Feeding Roles
Ecologists study nature across several distinct scales. At the broadest level, the biosphere is the part of the Earth where life can exist, encompassing the land, oceans, and lower atmosphere. Within the biosphere, organisms function in interconnected units:
- Ecosystem: A community of organisms interacting with each other and with their physical and chemical environment as an integrated unit (such as a deciduous woodland, freshwater lake, or rocky shore).
- Habitat: The place where an organism lives.
- Population: All the individuals of the same species living together in a defined area at a given time.
- Community: All the different populations of organisms living and interacting in a shared habitat.
Feeding Vocabulary
The word trophic means feeding. A trophic level is the feeding position of an organism in a food chain:
- Producer: An autotrophic organism that makes its own food using solar energy during photosynthesis (such as grass or phytoplankton).
- Consumer: An organism that obtains its energy by feeding on other organisms.
- Herbivore: An animal that eats only plants.
- Carnivore: An animal that eats only other animals.
- Omnivore: An animal that eats both plants and animals.
- Decomposer: A microorganism (such as a bacterium or fungus) that breaks down dead organic matter, releasing minerals and nutrients back into the soil and water.
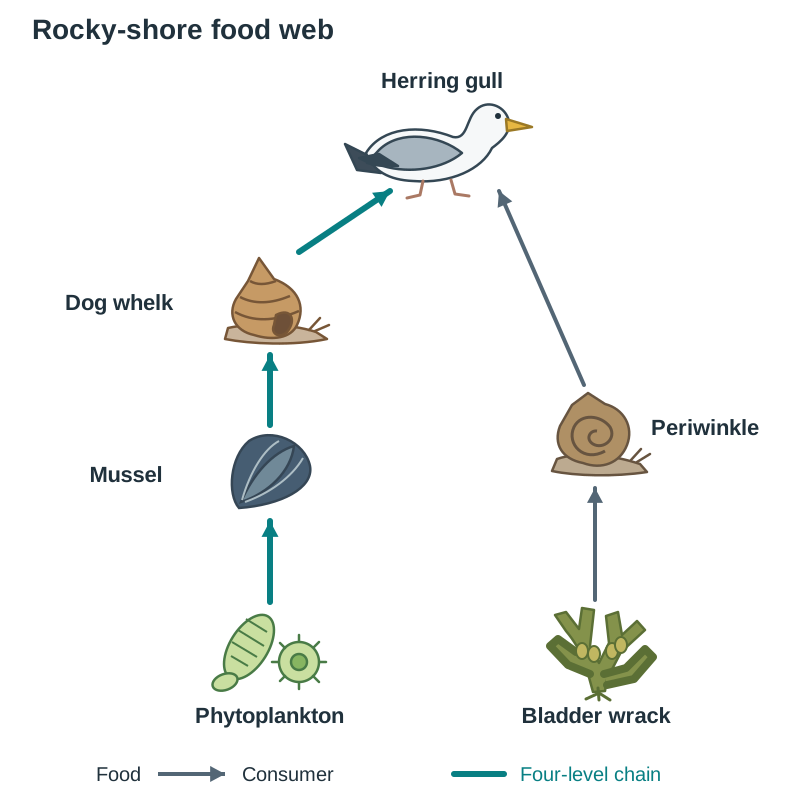
A food chain is a sequence of organisms in which each is eaten by the next, while a food web consists of two or more interlinked food chains representing feeding relationships in an ecosystem.
Energy Flow and Ecological Pyramids
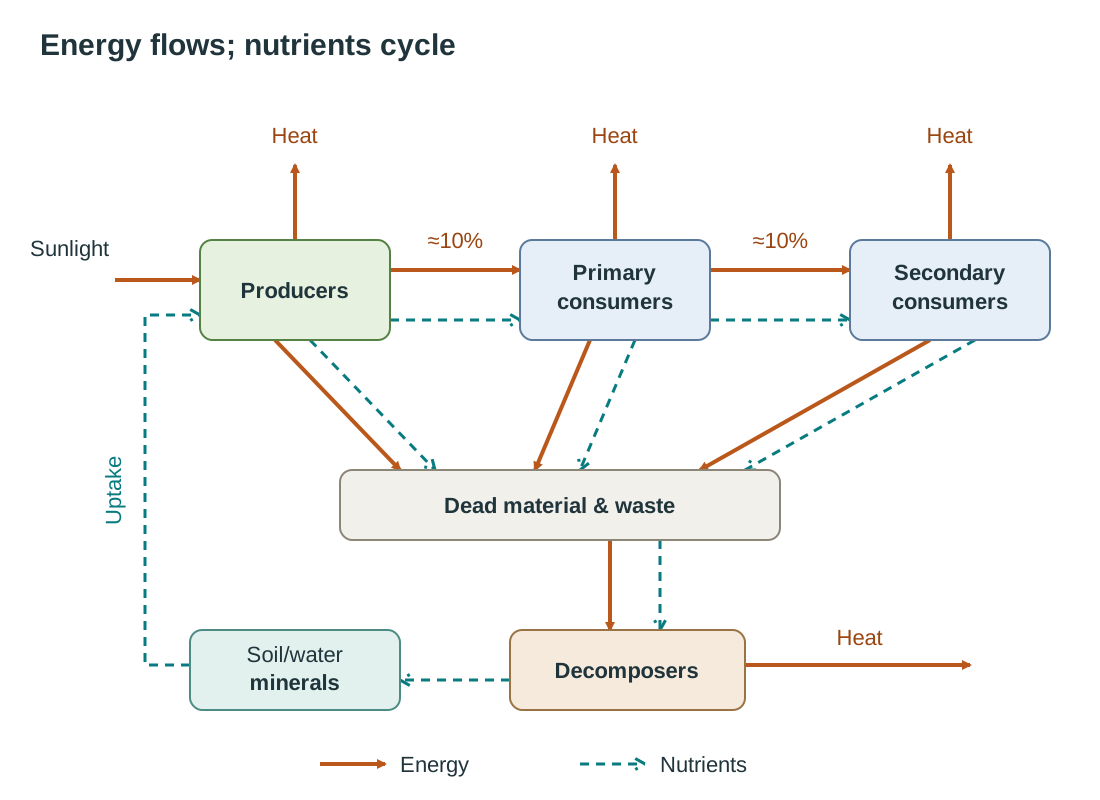
While nutrients cycle continuously through ecosystems, energy moves in one direction only. The sun is the primary source of energy. Primary producers capture solar energy and convert it into chemical energy through photosynthesis. When consumers feed, energy passes along the food chain, but this transfer is inefficient. Nutrients such as carbon and nitrogen pass from one trophic level to the next in the food that is eaten. When organisms die, decomposers return these nutrients to the soil and water, so they can be used again (see the carbon and nitrogen cycles).
Only about 10% of the energy stored in biomass at one trophic level passes to the next. The remaining 90% is not passed on. Most is converted to heat during cellular respiration and lost to the surroundings, while the rest remains in unconsumed tissue and faeces that pass to decomposers. Because of this massive energy loss at each step, food chains are naturally limited to four or five trophic levels; beyond that, too little energy remains to sustain a breeding population.
Pyramids of Numbers and Pyramids of Biomass
Ecologists use pyramids to compare trophic levels quantitatively:
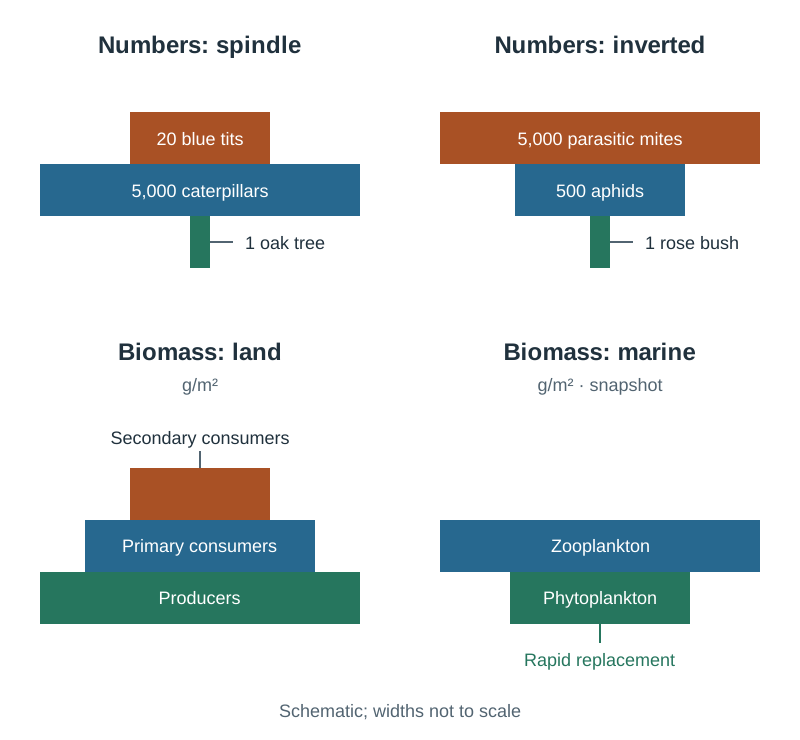
- A pyramid of numbers shows the count of individual organisms at each trophic level. While typically upright, it has limitations:
- Spindle-shaped: A single large oak tree supports 5,000 caterpillars, which in turn support 20 blue tits. The single large producer makes the base narrow.
- Inverted: A rose bush supports 500 aphids, which support 5,000 parasitic mites. The numbers increase at each successive level.
- Organism size is completely overlooked, and microscopic soil organisms are difficult to count accurately.
- A pyramid of biomass measures the total dry mass of living tissue at each trophic level (in ). On land, biomass pyramids are upright because energy loss limits total organic mass at higher levels.
- In marine ecosystems, an aquatic pyramid of biomass can appear inverted at a single moment. At any one moment the mass of phytoplankton can be less than the mass of zooplankton eating them. Phytoplankton reproduce so quickly that they are constantly replaced, so they still provide plenty of food over time.
| Feature | Pyramid of Numbers | Pyramid of Biomass |
|---|---|---|
| What is measured | Number of individual organisms at each level | Total dry mass of organisms at each level () |
| Organism size | Ignored (one oak tree equals one aphid) | Taken into account |
| Shape | Upright, spindle-shaped, or inverted | Almost always upright on land; occasionally inverted in water |
| Ease of measurement | Non-destructive and rapid | Destructive (drying kills organisms) and time-consuming |
| Similarity | Both represent feeding relationships at one point in time | Both represent feeding relationships at one point in time |
Species Interactions: Competition and Symbiosis
Living organisms constantly interact with one another. These biotic relationships shape population sizes and community structure.
Competition
Competition occurs when organisms struggle for a resource in limited supply, such as food, light, water, territory, or mates:
- Intraspecific competition: Competition between members of the same species (for example, two male red deer fighting over territory and mates, or oak seedlings competing for light beneath the parent tree).
- Interspecific competition: Competition between members of different species (for example, non-native grey squirrels outcompeting native red squirrels for hazelnuts and acorns in Irish woodlands).
Symbiosis
Symbiosis is a close, prolonged relationship between two organisms of different species in which at least one organism benefits. There are three categories:
- Mutualism: Both species benefit from the relationship.
- Rhizobium bacteria living in the root nodules of clover. The bacteria fix atmospheric nitrogen into nitrogen compounds (ammonium) that the clover uses to make proteins, while the clover provides the bacteria with carbohydrates and shelter.
- Symbiotic bacteria residing in the human large intestine, which produce essential vitamins (such as vitamin K) and inhibit pathogenic bacteria in exchange for nutrients and shelter.
- Commensalism: One organism benefits while the other is neither helped nor harmed.
- Barnacles attached to the shell of a crab or skin of a whale. The barnacle gains transportation to fresh plankton-rich waters, while the host animal is unaffected.
- Parasitism: One organism (the parasite) benefits by obtaining food and shelter from another living organism (the host), causing harm in the process.
- Liver fluke infecting sheep, fleas living on a red fox, or tapeworms absorbing digested nutrients inside a human gut.
The Ecological Niche and Adaptations
A habitat is the physical place where an organism lives, whereas an ecological niche is the functional role of an organism in its ecosystem. A niche includes what it eats, when it feeds, how it reproduces, its abiotic tolerances, and its interactions with other species.
An organism's structural, behavioural, or physiological adaptations fit it directly into its niche:
- The common pipistrelle bat occupies the niche of hunting small flying insects at night. It is adapted with modified wings for agile flight and an echolocation system to detect prey in complete darkness.
- The dog whelk occupies the niche of a carnivorous gastropod preying on barnacles and mussels on intertidal rocky shores. It possesses a muscular foot to resist dislodgement by waves and a specialised rasping, tongue-like radula to bore through the protective shell of its prey.
Two species cannot occupy the exact same ecological niche in the same habitat indefinitely because competition will drive one to extinction or displacement. Instead, species undergo niche partitioning:
- Spatial partitioning: Dividing physical space. In Irish broadleaf woods, blue tits hunt for caterpillars among the thin twigs of the upper canopy, whereas great tits forage lower down on larger boughs and on the ground.
- Temporal partitioning: Dividing activity time. Common pipistrelle bats and barn swallows both feed on flying insects, but swallows hunt by day using eyesight, while bats hunt by night using echolocation.
Limiting Factors, Carrying Capacity, and Population Curves
A population cannot expand indefinitely. The carrying capacity is the maximum number of individuals of a species that a specific environment can sustainably support over time without degrading the habitat.
Carrying capacity is determined by limiting factors:
- Abiotic limiting factors: Non-living physical and chemical components, such as light, temperature, water availability, space, oxygen, and edaphic (soil) factors like pH.
- Biotic limiting factors: Living components, including food supply, predation, parasitism, disease, and competition.
Irish Example: Red Deer in Killarney National Park
In Killarney, red deer numbers are restricted by abiotic factors (low winter temperatures and physical territory) and biotic factors (winter food availability and interspecific competition with introduced sika deer). Because natural apex predators like wolves are extinct in Ireland, predation no longer limits their numbers; populations are kept near carrying capacity by winter starvation and planned culls. If conditions change, carrying capacity shifts: a succession of mild winters increases available forage, allowing the population to stabilise at a higher number, whereas severe overgrazing destroys woodland saplings and lowers the habitat carrying capacity.
Population Growth Curves
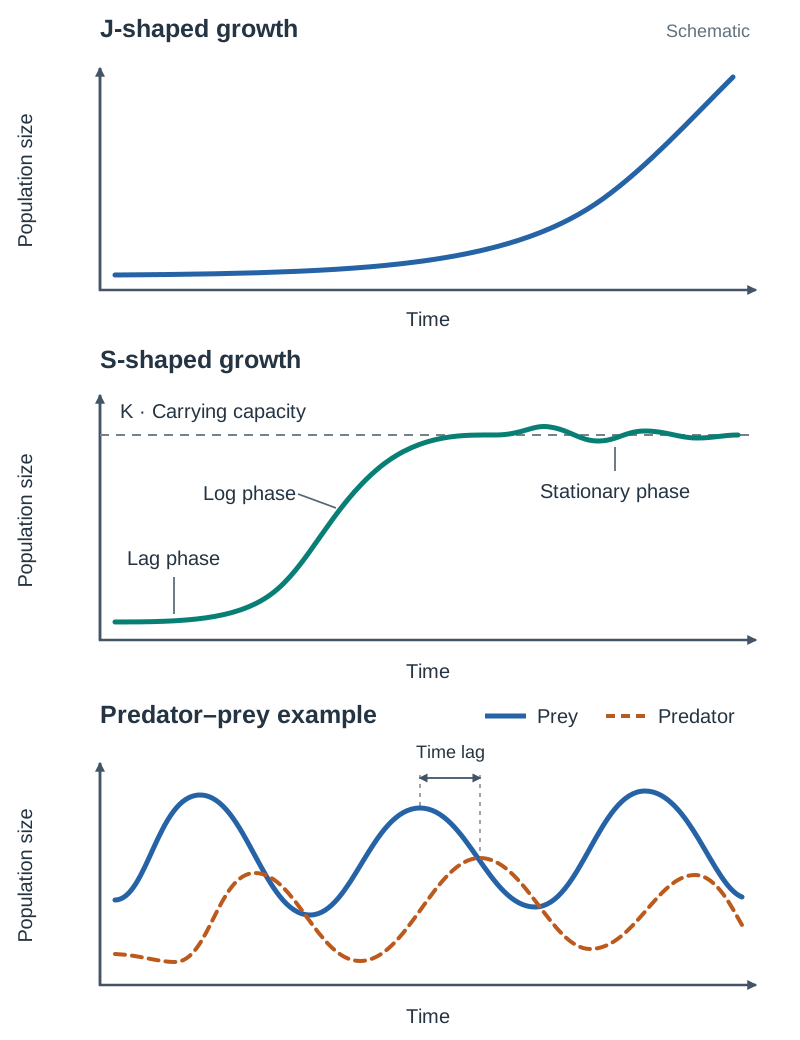
- J-shaped curve (Exponential growth): Occurs in environments with unlimited resources, ideal conditions, and no predators or disease. Numbers rise faster and faster, because the population doubles in the same length of time again and again. In nature, J-curves are temporary (such as algal blooms in summer or initial colonisation of a cleared field) and inevitably end in a sharp population crash when a key resource is exhausted.
- S-shaped curve (Logistic growth): Typical of natural, resource-limited populations. Growth starts slowly during a lag phase, accelerates through an exponential log phase, and slows down as limiting factors take effect, finally settling into a stationary phase that fluctuates around the carrying capacity.
Predator-Prey Relationships
When graphed against time, predator and prey populations show linked oscillations with two features:
- Predator peaks are lower than prey peaks because roughly 90% of energy is lost between trophic levels, leaving less energy to support predators.
- Predator peaks lag behind prey peaks because predators require time to consume food, mate, gestate, and rear young before their numbers increase.
Biodiversity, Human Impact, and Conservation
Biodiversity refers to the variety of life on Earth across three levels: genetic diversity (variety of genes within a species), species diversity (number and relative abundance of species), and ecosystem diversity (variety of distinct habitats).
Human activities such as land clearance, fertiliser runoff, pollution, and introducing non-native species drive biodiversity loss. This loss produces four major impacts:
- Environmental: Disrupted food webs, loss of natural pest control, degraded soil quality, and impaired water filtration.
- Economic: Reduced crop yields due to pollinator decline, collapsing marine fish stocks, and loss of revenue from nature tourism.
- Social: Loss of access to natural amenities, diminished recreational well-being, and increased public health vulnerabilities.
- Cultural: Loss of folklore, traditional farming heritage, native language terms, and cultural connection to native landscapes.
Conservation is the wise management and protection of our environment and natural resources to maintain biodiversity and prevent extinction.
Irish Conservation Actions
- Protected areas: Designating National Parks (such as Killarney and Wicklow Mountains) and Special Areas of Conservation (SACs) to protect intact habitats from development.
- Bog restoration: Rewetting cutaway raised and blanket bogs by blocking drainage ditches, allowing Sphagnum moss to regenerate and store carbon.
- Species reintroduction: Reintroducing apex raptors such as the golden eagle in Donegal and white-tailed sea eagle in Kerry.
- Invasive species control: Eradicating Rhododendron ponticum from native oak woodlands in Killarney to let native woodland flora regenerate.
- Farming for nature: Leaving hedgerows and uncultivated field margins to support pollinators and farmland birds like the yellowhammer.
Conservation decisions involve economic and social trade-offs; for instance, rewetting bogs restricts turf-cutting livelihoods, requiring balanced consultation with local communities.
Simpson's Diversity Index ()
Ecologists measure species diversity using both species richness (number of different species) and species evenness (how evenly distributed the individuals are):
- = total number of individuals of a particular species
- = total number of individuals of all species combined
A value close to 1 indicates high diversity (many species, evenly spread), which is usually linked to a more stable community. A value near 0 indicates low diversity, with one species dominating.
Studying a Habitat (Ecological Investigation)
Field investigations generate primary data to model habitats, evaluate species distribution, and explore ecological relationships.
1. Habitat Modelling and Mapping
Produce a sketch map of the chosen habitat (such as a hedgerow, grassland, or rocky shore). Record its physical dimensions, dominant plant and animal species, prevailing abiotic factors, a north indicator arrow, and a clear key.
2. Collection Methods for Fauna
Choose collection apparatus suited to the organism's ecology:
- Pooter: A small jar with two tubes used to suck up small insects and spiders without harming them.
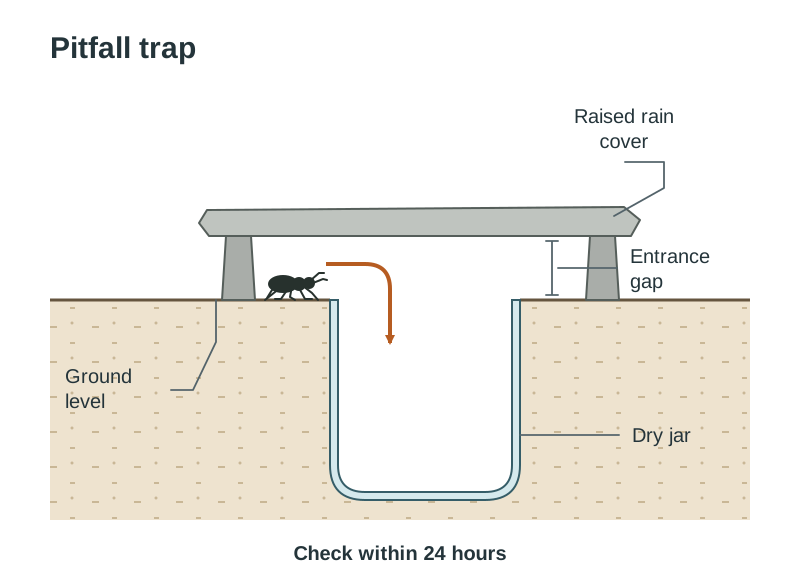
- Pitfall trap: A jar sunk level with the ground surface, protected by a raised flat stone to exclude rain. It catches ground-dwelling invertebrates like ground beetles. It must be checked within 24 hours to prevent trapped animals preying on one another.
- Sweep net: Swept in a figure-of-eight motion through tall grass to catch insects and other small animals living on the vegetation.
- Beating tray: A white sheet positioned beneath tree branches; the branch is struck sharply, dislodging invertebrates onto the cloth.
- Plankton / pond net: Swept through open water or weed beds to catch aquatic larvae and microscopic plankton.
- Mammal trap (Longworth trap): A baited metal box trap used to capture small mammals like wood mice alive for identification.
3. Identification
Organisms are identified using a dichotomous key, which presents a succession of paired, mutually exclusive physical statements (such as 'wings present' vs 'wings absent') until the organism is classified.
4. Quantitative Surveys of Flora
- Qualitative survey: Records presence or absence of species, compiling a species inventory.
- Quantitative survey: Measures abundance or distribution.
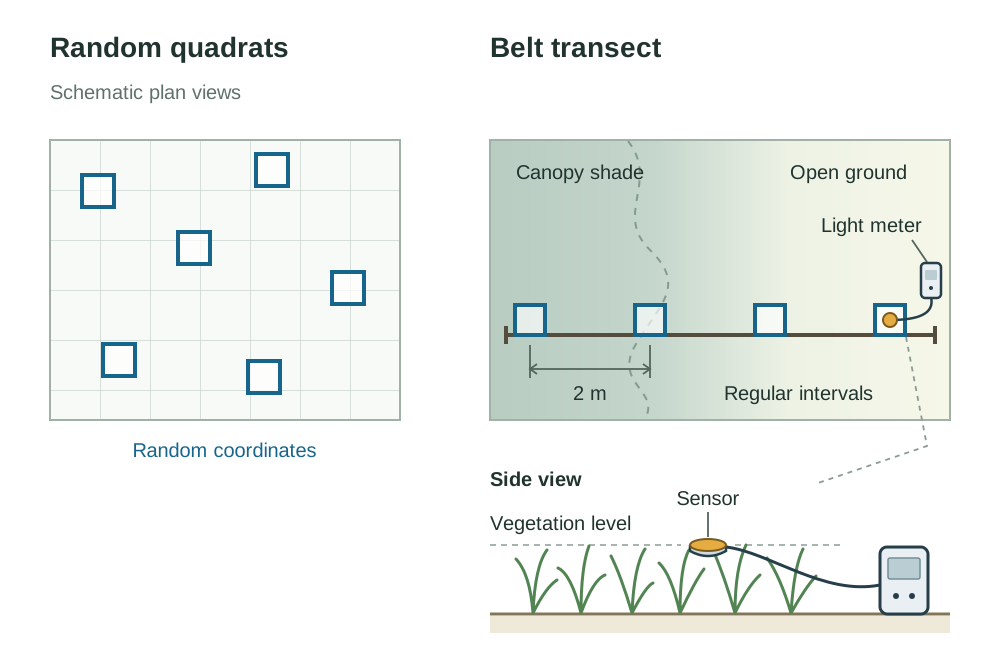
- Random quadrats: A square frame (typically ) placed using coordinates selected from a random number generator to avoid human selection bias. Ecologists record percentage cover (visual estimate of quadrat ground area occupied by a plant species) or percentage frequency (percentage of sample quadrats containing the species).
- Belt transect: A marked line laid across an environmental gradient (for example, from deep tree shade into open field). Quadrats are placed at regular intervals (for example every 2 m) along the line, or end to end, to show how species abundance changes along an abiotic gradient.
5. Measuring Abiotic Factors
Abiotic variables must be measured at the same sampling points where organisms are recorded:
- Air, soil, or water temperature: Alcohol-filled thermometer or digital temperature probe.
- Light intensity: Digital light meter held at vegetation level.
- Soil or water pH: Portable digital pH meter or universal indicator solution.
- Dissolved oxygen: Dissolved oxygen probe in aquatic habitats.
- Wind speed: Rotating-cup anemometer.
- Slope: Clinometer.
- Aspect: Magnetic compass.
- Soil moisture content: Weigh fresh soil, dry in an oven at 100 °C until mass remains constant, and calculate percentage mass loss.
6. Minimising Experimental Error
Ensure unbiased sampling using random coordinates, collect large sample sizes to improve representativeness, record weather conditions on the day, and repeat surveys across seasons to evaluate repeatability.
Key terms
- Ecology
- The study of the interactions between living organisms and their environment.
- Biosphere
- The part of the Earth where life can exist.
- Ecosystem
- A community of organisms interacting with one another and with their physical and chemical environment.
- Habitat
- The place where an organism lives.
- Population
- All the members of the same species living in a particular habitat at the same time.
- Community
- All the different populations of organisms living and interacting in a particular habitat.
- Trophic Level
- The feeding position of an organism in a food chain.
- Carrying Capacity
- The maximum number of individuals of a species that a specific environment can sustainably support over time.
- Ecological Niche
- The functional role of an organism in an ecosystem, including its feeding habits, habitat use, and interactions with other species.
- Competition
- The struggle between organisms for resources in short supply, such as food, light, space, or mates.
- Symbiosis
- A close relationship between two organisms of different species in which at least one benefits.
- Mutualism
- A form of symbiosis in which both organisms benefit.
- Commensalism
- A form of symbiosis in which one organism benefits while the other is neither helped nor harmed.
- Parasitism
- A form of symbiosis where one organism (the parasite) benefits at the expense of another living organism (the host).
- Biodiversity
- The variety of living organisms, their genetic differences, and the ecosystems they form.
- Conservation
- The wise management and protection of the environment and its natural resources to maintain biodiversity.
- Biomass
- The total dry mass of living organic matter present at a particular trophic level or area.
- Abiotic Factor
- A non-living physical or chemical factor that influences an ecosystem, such as temperature, pH, or light.
- Biotic Factor
- A living factor that influences an ecosystem, such as predation, disease, or competition.
- Dichotomous Key
- A guide used to identify organisms consisting of a series of paired, contrasting statements.
- Percentage Cover
- An estimate of the percentage of ground surface within a quadrat occupied by a specific plant species.
- Percentage Frequency
- The percentage of quadrats sampled that contain a particular species.
Check yourself
What is the difference between a population and a community?
A population consists of all the individuals of a single species living in a habitat, while a community consists of all the different populations of all species living and interacting in that habitat.
Give one reason why predator population peaks occur after prey peaks, and one reason why predator peaks are lower.
Predator peaks lag because predators require time to consume food, mate, and rear young before numbers rise. Predator peaks are lower because roughly 90% of energy is lost between trophic levels.
Name the symbiotic relationship between clover and Rhizobium bacteria and explain why it is classified this way.
It is mutualism because both organisms benefit: Rhizobium fixes atmospheric nitrogen into nitrogen compounds (ammonium) that the clover uses to make proteins, while the clover provides the bacteria with carbohydrates and shelter.
Calculate Simpson's Diversity Index () for a sample containing 3 species with counts .
Total , so . . (or ).
A severe drought significantly reduces the food supply for a rabbit population currently at carrying capacity. What happens to the S-shaped population curve?
The population curve falls due to increased mortality and starvation, stabilising at a new, lower carrying capacity.
Distinguish between intraspecific and interspecific competition, giving one example of each.
Intraspecific competition occurs between members of the same species (e.g. red deer stags fighting for mates), whereas interspecific competition occurs between members of different species (e.g. grey squirrels and red squirrels competing for acorns).