

Scientific practices form the foundation of Leaving Certificate Agricultural Science (Strand 1). This strand is about how farmers, advisors and researchers actually find things out: how they turn something they notice in a field into a question, test it properly, and decide whether the answer can be trusted. Assessment is split into two components: a 2.5-hour written examination worth 75% (testing short, structured, and synoptic questions) and Coursework worth 25%, awarded for the Individual Investigative Study alone. Separately, every student must complete and report on the specified practical activities and keep them in a portfolio; these reports are compulsory but are not externally marked.
Formulating Hypotheses and Fair Testing
Scientific inquiry in agriculture begins with an observation in the field or laboratory. You might notice that perennial ryegrass (Lolium perenne) establishes faster under minimum tillage than conventional ploughing, or that calves fed pooled colostrum perform identically to calves fed dam colostrum.
From an observation, you form a hypothesis. A hypothesis is a testable, proposed explanation for an observed phenomenon. It cannot be vague speculation; it must propose a clear relationship that experimentation can support or refute. A sound hypothesis is specific, measurable, and testable. Once formulated, your hypothesis generates a specific prediction stating what will happen under defined conditions.
| Weak Statement | Why It Is Weak | Better Hypothesis |
|---|---|---|
| 'Does fertiliser make grass grow better?' | Written as a question; 'better' cannot be measured. | 'Increasing the application rate of protected urea increases the dry matter yield of perennial ryegrass.' |
| 'Lime is good for soil.' | 'Good' is subjective and lacks any measurable mechanism. | 'Applying ground limestone to an acidic mineral soil raises soil pH towards the optimum range of 6.3 to 6.5.' |
A fair test alters only one factor at a time:
- Independent Variable: The single factor you deliberately alter across treatments (e.g. application rate of nitrogen fertiliser in kg N/ha).
- Dependent Variable: The factor you measure to record the treatment effect (e.g. grass dry matter yield in kg DM/ha).
- Controlled Variables: All other environmental and physical factors kept strictly constant across all treatments (e.g. soil type, moisture level, sward composition, and light exposure).
- Control Group: A baseline setup receiving no active treatment (e.g. an unfertilised plot receiving 0 kg N/ha). The control proves whether the observed change is caused by the independent variable or by background environmental conditions.
'Is This a Fair Test?' — How to Answer
When exam questions ask whether a setup is a fair test, state a clear verdict followed by a specific named factor from the trial:
- If it is fair: state that only the independent variable differed, and identify key controlled variables. For example: 'Yes. Only the type of colostrum differed between the groups. Each group contained 20 calves, all colostrum met the standard of >50 mg/ml IgG, and all calves were weighed at the same weekly interval.'
- If it is not fair: name the confounding variable and explain how it distorts the result. For example: 'No. The high-nitrogen plots were on the sheltered side of the field, so differences in yield could be caused by shelter and soil moisture rather than by the fertiliser rate.'
Designing and Describing an Investigation
Questions asking you to 'Describe an investigation to...' or 'Describe, with the aid of a labelled diagram...' are among the most common long-question types on the paper. Examiners mark these as a list of separate method points, not as an essay. Use numbered steps and ensure your answer includes:
- Materials: Name the apparatus and the two or more treatments being compared.
- Equal starting quantities: State identical masses, volumes, or sample counts.
- Step-by-step method: Write sequential steps with measurable quantities (mass in g, height in mm, time in minutes or hours).
- Variables: Identify what you change (independent variable) and what you measure (dependent variable).
- Control: Include an untreated setup where possible.
- Two controlled variables: Explicitly state two factors kept constant.
- A stated time: Give a definite, realistic timeframe (e.g. 'leave for one hour', 'incubate for 24 hours').
- Repeat and mean: State explicitly that you repeat the procedure and calculate a mean.
- The result: State the precise observation expected.
- A conclusion: Link the result back to the hypothesis and state why it matters on the farm.
- Labelled diagram: When requested, draw a simple two-dimensional section, rule straight label lines to every named item (no arrowheads crossing each other), and do not shade.
Full Worked Method: Capillarity Investigation
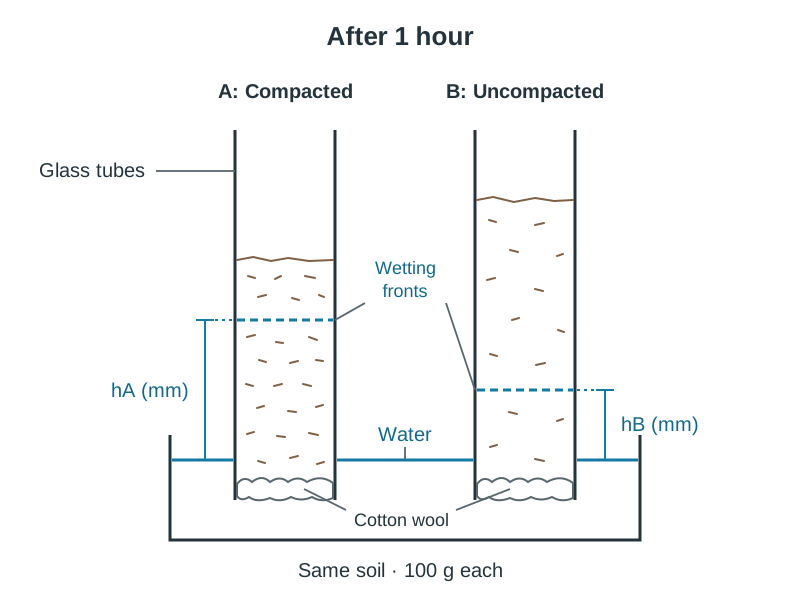
Question: Describe, with the aid of a labelled diagram, an investigation to compare the capillarity of a compacted and an uncompacted soil. State the result.
- Take two identical open-ended glass tubes and plug the base of each with cotton wool.
- Fill tube A with 100 g of oven-dry soil, packing it down firmly with a wooden dowel to compact it.
- Fill tube B with 100 g of the same dry soil, poured in loosely without compaction.
- Stand both tubes upright in the same trough or beaker of water, ensuring the cotton-wool ends are submerged to an equal depth.
- Leave undisturbed for one hour.
- Using a ruler, measure the vertical height in mm that water has risen through the soil column in each tube.
- Repeat the investigation using three tubes of each soil condition and calculate the mean rise for each.
- Controlled variables: same soil type, same mass of soil (100 g), same tube internal diameter, same water temperature, same depth of immersion.
- Result: Water rises significantly higher up the tube containing the compacted soil.
- Conclusion: Compaction compresses the soil pores into narrower channels. Narrower capillary pores exert a stronger upward adhesive pull, drawing water higher against gravity. On the farm: Compacted headlands and tractor wheelings stay wet near the surface, warm up slower in spring, and delay early grass growth.
Fieldwork, Sampling, and Experimental Units
Outdoor agricultural trials face unpredictable weather, varying slopes, and uneven soil fertility. Designing field trials requires disciplined sampling to ensure results represent the whole field.
Representative Field Sampling
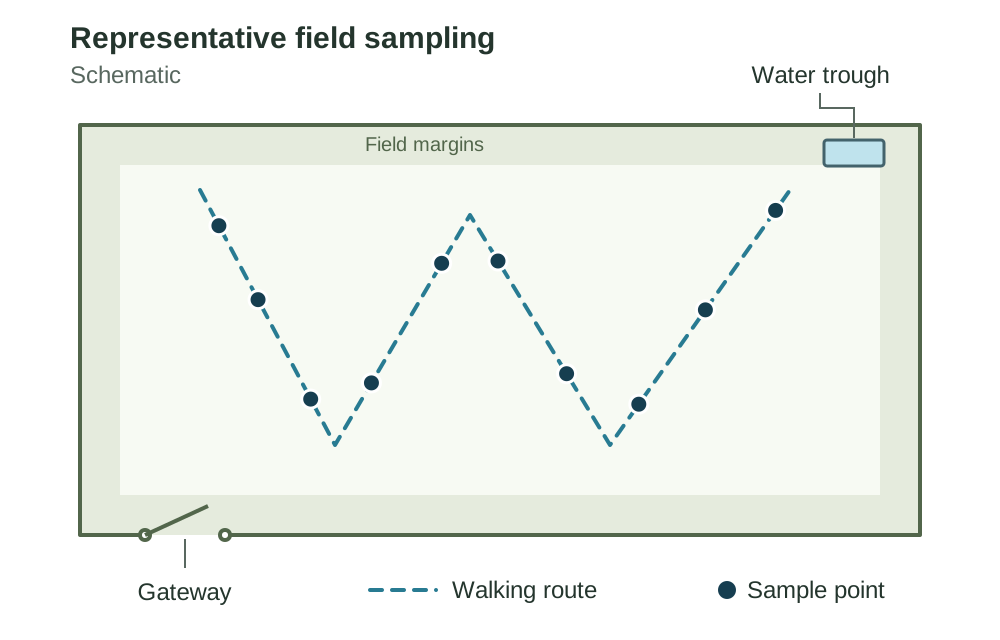
Sampling from one convenient gateway or corner introduces severe selection bias. To collect a representative sample across a pasture:
- Walk the field in a structured 'W' or 'X' pattern.
- Collect a minimum of 10 to 20 randomised soil cores or quadrat throws along this route.
- Avoid unrepresentative areas such as gateways, headlands, water troughs, dung pats, and boundary tree lines.
- Why this matters on the farm: If you took all your soil cores near a gateway, you would sample soil enriched with extra dung, urine, and machinery compaction. The laboratory would report an artificially high phosphorus index, leading the farmer to under-fertilise the remaining 95% of the field.
Experimental Units versus Repeated Readings
A vital distinction in agricultural trials is that between independent replicates and repeated measurements:
- Replicate (independent experimental unit): A separate plot, pot, or animal that receives the treatment on its own. For example, three separately sown pots of ryegrass receiving 60 kg N/ha represent three true replicates. Replicates account for natural biological variation and allow you to calculate a reliable mean.
- Repeated Measurements: Weighing or measuring one single pot three times tests only measuring precision. It does not provide three replicates of the treatment.
Presenting and Reading Results
Learning outcome 1.4 requires you to communicate results through tables, graphs, and reports, while 1.3 requires drawing conclusions from graphic and numeric data.
Results Tables and Graph Conventions
- Tables: Place the independent variable in the left column. Place measured values in the columns to the right, and put the mean in the final column. Always place units in the column headings (e.g. 'Dry Matter Yield (kg DM/ha)') — never write the unit beside every individual number.
- Graphs: Always plot the independent variable on the x-axis and the dependent variable on the y-axis. Label both axes clearly with the quantity and its unit. Choose an even scale filling at least half the grid. Use a bar chart when the independent variable is categorical (fertiliser type, breed, soil type); use a line or scatter graph when the variable is continuous (nitrogen rate, time, temperature).
Answering 'Analyse the graph and describe the conclusion'
You must quote figures directly off the graph. A conclusion without numbers will lose marks.
Worked example (fertiliser leaching graph): 'Unprotected urea yielded a nitrate concentration of approximately 250 mg/l in soil water, which is five times higher than the approximately 50 mg/l recorded from protected urea, with the untreated control lowest of all. I conclude that the data support the hypothesis: protected urea significantly reduces nitrate leaching compared with conventional urea. On the farm, using protected urea in nitrates-vulnerable zones reduces groundwater pollution and lowers the risk of waterway eutrophication.'
Specified Practical: Percentage Water Content of a Soil Sample
- Method: Weigh a clean crucible. Add fresh soil and record the mass. Place in a drying oven at 105 °C. Remove, cool in a desiccator, and reweigh. Repeat heating and weighing until a constant mass is reached (proving all water has evaporated).
- Formula:
- Example: Crucible = 30.0 g; Crucible + fresh soil = 80.0 g; Crucible + dry soil = 71.0 g.
- Mass of fresh soil = 80.0 − 30.0 = 50.0 g.
- Mass of dry soil = 71.0 − 30.0 = 41.0 g.
- Mass of water lost = 50.0 − 41.0 = 9.0 g.
- % water content = (9.0 ÷ 50.0) × 100 = 18.0%.
- Farm link: Soil moisture indicates trafficability. Operating heavy machinery on saturated soils destroys structure and induces compaction.
Data Handling: Uncertainty, Accuracy, and Precision
Gathering data involves both primary data (measurements you collect directly) and secondary data (published findings from agencies like Teagasc, DAFM, or Met Éireann).
Every physical measurement carries inherent uncertainty:
- Statistical Uncertainty (Random Error): Arises from unpredictable biological differences between living organisms or minor environmental fluctuations (e.g. natural differences in daily gain among bullocks on the same feed). You reduce statistical uncertainty by using larger sample sizes, testing multiple independent replicates, and calculating an average.
- Systematic Uncertainty (Systematic Error): Arises from uncalibrated instruments, zero-offset errors, or flawed methods that bias every reading in the same direction. For instance, a spring balance that reads +0.5 kg when empty makes every fleece or calf 0.5 kg too heavy. Repeating measurements will not fix a systematic error; you must calibrate the instrument against certified standards or zero the balance before weighing.
Accuracy versus Precision
Examiners regularly test the difference between accuracy and precision using numerical datasets:
| Measurement Quality | Definition | Example (Certified Soil pH = 6.5) |
|---|---|---|
| Accurate and precise | Close to the true value and tightly clustered. | 6.5, 6.4, 6.5, 6.5 |
| Precise, not accurate | Repeatable, but shifted by systematic error. | 7.1, 7.2, 7.1, 7.1 |
| Accurate, not precise | Average is close to true value, but individual values scatter. | 6.1, 6.9, 6.2, 6.8 |
| Neither | Widely scattered and far from true value. | 5.3, 7.4, 5.9, 7.8 |
Causation versus Correlation
- Correlation: A statistical association where two variables change together. For example, silage contracting activity and grass yield both peak in May and June.
- Causation: A proven biological or physical mechanism where variable A directly produces the change in variable B. Warmer soil temperatures and longer photoperiods directly accelerate ryegrass photosynthetic rates, whereas contracting activity is merely correlated with the season.
Evaluating Evidence, Sources, and Ethics
When you evaluate evidence, you are answering one question: do these results actually support the claim being made? Two concepts decide it:
- Validity: A trial is valid if it genuinely measures what it claims to test, with all confounding variables controlled. Measuring only sward height to compare fertiliser productivity is invalid because it ignores sward density and dry matter percentage.
- Reliability: A trial is reliable if its methods yield consistent, reproducible results when repeated across independent trials, seasons, and locations.
Handling Anomalies
An anomalous result (an outlier) is a reading that does not fit the pattern of the others — for example, one plot yielding far less than its two neighbours at the same fertiliser rate. Never discard an unexpected reading simply because it contradicts your hypothesis. Inspect the setup for physical causes (rabbit damage, blocked dripper, gateway compaction). Note the reading and repeat if possible. If an objective physical cause is verified, the reading may be excluded from the mean, provided this is explicitly documented in the report. If no cause is found, the reading must be retained.
The 'Lab-to-Field Gap'
Controlled laboratory experiments exclude weather extremes, pest infestations, weed competition, and soil variation. A biopesticide that kills 99% of fungal spores in an incubator may break down under outdoor UV radiation or wash off foliage in heavy rain. Farm recommendations require multi-site, multi-year field trials.
Judging Secondary Sources and Claims
When evaluating a commercial claim ('Product X boosts yield by 30%'), apply five checks:
- Author and funding: Is the source independent? Teagasc, universities, and peer-reviewed journals are more reliable than promotional product brochures.
- Control: Was an untreated control group run alongside the trial?
- Replication and scale: How many independent replicates were used?
- Trial duration and locations: Was it tested across multiple Irish soil types and weather seasons?
- Date: Is the guidance current and aligned with modern agricultural regulations?
Ethical Evaluation
- Animal Welfare — the Five Freedoms: Freedom from hunger and thirst; freedom from discomfort (sheltered lying areas); freedom from pain, injury, and disease; freedom to express normal behaviour (adequate space and herd contact); freedom from fear and distress.
- Environmental Ethics: Preventing nutrient runoff into waterways, cutting ammonia and greenhouse gas emissions, and maintaining field buffer zones.
Working Safely in Agricultural Investigations
Farming carries one of the highest fatal injury rates of any sector in Ireland. Conducting scientific investigations in the laboratory or on a commercial holding requires prior risk assessments and strict controls.
Writing a Risk Assessment
Every practical you report should carry a concise risk assessment using three columns. Always finish with a specific control measure:
| Hazard (thing causing harm) | Risk (what could happen) | Control (precaution taken) |
|---|---|---|
| Drying oven at 105 °C | Burns to hands | Wear heat-resistant gloves; handle hot vessels with tongs |
| Benedict's and iodine reagents | Eye damage, chemical skin irritation | Wear safety goggles and nitrile gloves; never mouth-pipette |
| Slurry agitation in slatted unit | Inhaling hydrogen sulphide, asphyxiation | Agitate on a windy day, open all doors, evacuate livestock and people, stay out for 30 mins |
| Large cattle in handling race | Crushing, kicking | Use a certified crush with headgate; maintain an unobstructed escape route |
| Field sampling near livestock | Trampling or charge by stock | Do not enter fields with bulls or calved cows; move stock prior to sampling |
Key Farm Hazards and Terminology
- Slurry Gases: Anaerobic breakdown releases methane, carbon dioxide, ammonia, and hydrogen sulphide (). is heavier than air and collects near floor slats. Below 30 ppm it smells of rotten eggs, but above 100 ppm it rapidly causes olfactory fatigue (nerve paralysis). Smell disappears immediately before respiratory paralysis and collapse.
- Power Take-Off (PTO): Tractor PTO stub shafts rotate at 540 or 1,000 RPM, easily catching clothing. Shafts must be enclosed in an undamaged tubular plastic guard secured by anti-rotation chains.
- Machinery Overturns: Tractors must have a certified Roll-Over Protective Structure (ROPS) and operators must wear seatbelts.
- Zoonoses: A zoonosis is an infection transmissible from animals to humans, such as ringworm (Trichophyton verrucosum), leptospirosis (Leptospira hardjo), or cryptosporidiosis. Prevent infection with nitrile gloves, waterproof dressings on cuts, and thorough hand washing.
Coursework: The Practical Portfolio and the IIS
Leaving Certificate Agricultural Science assessment is divided into two distinct components:
- Written Examination (75%): A 2.5-hour terminal paper featuring short answer questions, structured single-topic questions, and synoptic questions that connect multiple strands around a practical farm scenario.
- Coursework (25%): Awarded for the Individual Investigative Study (IIS) alone, assessed at a common level.
The Portfolio of Specified Practical Activities
Throughout the two-year course, students must complete and maintain an individually reported portfolio of laboratory and field practicals marked with an asterisk (*) in the specification. These include:
- Demonstrating cation exchange capacity (CEC), flocculation, and soil pH.
- Soil texture analysis using sedimentation, sieving, and hand testing.
- Comparing capillarity and infiltration rates between compacted and uncompacted soils.
- Calculating the percentage water content of a soil sample.
These practical reports are not externally assessed, but they must be available for inspection and retained until the end of the assessment process.
The Individual Investigative Study (IIS)
Each student completes an individual study based on a thematic brief set by the State Examinations Commission for your examination cohort at the start of the two-year course, and worked on across both years. The report follows standard scientific headings:
- Title / Research Question: Stated clearly and concisely.
- Aim: Single-sentence goal of the project.
- Hypothesis and Prediction: The testable proposed explanation and the measurable outcome expected.
- Background Research: Reviewing secondary sources (Teagasc, DAFM, scientific publications).
- Materials and Apparatus: Quantities and specifications.
- Method: Numbered, reproducible steps in the past impersonal tense ('100 g of soil was weighed'), including controls, controlled variables, and replicate counts.
- Results: Tables of raw data, calculated means, and graphs.
- Analysis and Discussion: Describing trends, quoting figures, and contrasting with published studies.
- Conclusion: Stating whether the data support the hypothesis, with a link to farm practice.
- Evaluation: Sources of uncertainty, anomalies, and specific procedural improvements.
- References: Citations of all sources used.
Key terms
- Hypothesis
- A testable, proposed explanation for an observed agricultural phenomenon, serving as the basis for experimentation.
- Prediction
- A specific, measurable statement of what will be observed in an experiment if the hypothesis is supported.
- Independent Variable
- The single factor deliberately altered or manipulated across treatments by the investigator.
- Dependent Variable
- The factor measured or recorded to evaluate the response caused by changing the independent variable.
- Controlled Variable
- Any environmental or experimental factor held strictly constant across all treatments to ensure a fair test.
- Control Group
- An untreated baseline treatment run alongside test groups to prove that the independent variable caused the observed response.
- Accuracy
- How close a measured value or calculated treatment mean is to the true, accepted reference value.
- Precision
- The closeness of agreement among repeated measurements of the same quantity under identical experimental conditions.
- Statistical Uncertainty
- Random scatter in experimental data caused by biological variation or measurement noise, minimised by replicates and averaging.
- Systematic Uncertainty
- A constant offset or bias caused by uncalibrated equipment or flawed technique, eliminated only by instrument calibration.
- Reliability
- The consistency and repeatability of results when an investigation is repeated under comparable conditions.
- Validity
- The extent to which an experimental design genuinely measures what it set out to test, free from confounding variables.
- Hydrogen Sulphide (H₂S)
- A heavier-than-air toxic gas produced during slurry agitation that causes rapid olfactory nerve paralysis and respiratory failure.
- Power Take-Off (PTO)
- A tractor drive shaft rotating at 540 or 1,000 RPM requiring a fully intact, tethered tubular guard to prevent fatal entanglement.
- Roll-Over Protective Structure (ROPS)
- A certified safety frame or cab fitted to tractors to preserve operator survival space during overturns when a seatbelt is worn.
- Zoonosis
- An infectious disease naturally transmissible between vertebrate animals and humans, such as ringworm or leptospirosis.
- Individual Investigative Study (IIS)
- A 25% coursework component involving an open-ended practical research study based on an SEC thematic brief set for the cohort.
Check yourself
What is the difference between an independent variable and a dependent variable?
The independent variable is the single factor deliberately manipulated by the experimenter, while the dependent variable is the factor measured to evaluate the outcome.
Describe how you would investigate the effect of temperature on the germination rate of spring barley seed.
1. Place 50 spring barley seeds on moist filter paper in each of four Petri dishes. 2. Keep moisture, seed batch, and light conditions constant. 3. Place one dish in an incubator at 5 °C, one at 10 °C, one at 15 °C, and one at 20 °C. 4. Leave for 7 days. 5. Count and record the number of germinated seeds in each dish to calculate percentage germination. 6. Repeat with three dishes per temperature and calculate the mean germination percentage for each.
A student measures the dry matter yield of three replicate plots of clover at 0 kg N/ha (yields: 180, 185, 175 g/m²) and at 40 kg N/ha (yields: 182, 186, 178 g/m²). Calculate the means and state a conclusion.
Mean at 0 kg N/ha = (180 + 185 + 175) ÷ 3 = 180.0 g/m². Mean at 40 kg N/ha = (182 + 186 + 178) ÷ 3 = 182.0 g/m². Conclusion: Adding nitrogen fertiliser had virtually no effect on yield (a difference of only 2.0 g/m²), because clover fixes its own atmospheric nitrogen via symbiotic Rhizobium root nodules.
A spring balance reads +0.4 kg when empty. An operator weighs 10 fleece samples twice and calculates an average. Does this eliminate the error?
No. The offset is a systematic uncertainty that biases every reading by +0.4 kg. Repeating and averaging only reduces statistical uncertainty; the balance must be re-zeroed or calibrated.
A reference soil has an exact pH of 6.2. A digital meter records 6.8, 6.8, 6.9, and 6.8. Describe the data in terms of accuracy and precision.
The data are precise (highly consistent and repeatable) but inaccurate (shifted systematically above the true value of 6.2).
A student compares two silage additives by applying additive A to pit 1 cut in May and additive B to pit 2 cut in July. Explain whether this is a fair test.
It is not a fair test. Grass maturity, sward sugar content, and weather differed between May and July. Because these confounding variables were not controlled, any difference in preservation quality cannot be attributed to the additive alone.
What is the assessment weighting and structure of the coursework component in Leaving Certificate Agricultural Science?
Coursework accounts for 25% of the total marks and is awarded solely for the Individual Investigative Study (IIS). The portfolio of specified practical activities is compulsory and must be retained for inspection, but carries no external marks.