

This note covers the 19 specified practical activities required for Leaving Certificate Agricultural Science across soils, crops, and livestock. In the written examination, practical work is assessed through short questions in Section A testing single steps, precautions, or calculations, and long questions in Section B requiring full investigations with labelled diagrams, variables, and farm applications. Marking schemes consistently reward concise methods in three to five clear actions rather than elaborate laboratory protocols.
Demonstrating cation exchange capacity of soil
Higher level only.
Aim Demonstrate that soil colloids hold and exchange mineral cations in solution.
Apparatus and materials Funnel, filter paper, beaker, soil sample, potassium chloride solution, ammonium oxalate solution.
Method
- Place soil into filter paper in a funnel supported over a beaker.
- Pour potassium chloride solution slowly onto the soil.
- Collect the liquid that filters through (leachate) in the beaker.
- Add drops of ammonium oxalate solution to the collected leachate.
- Repeat adding potassium chloride until the leachate no longer forms a precipitate.
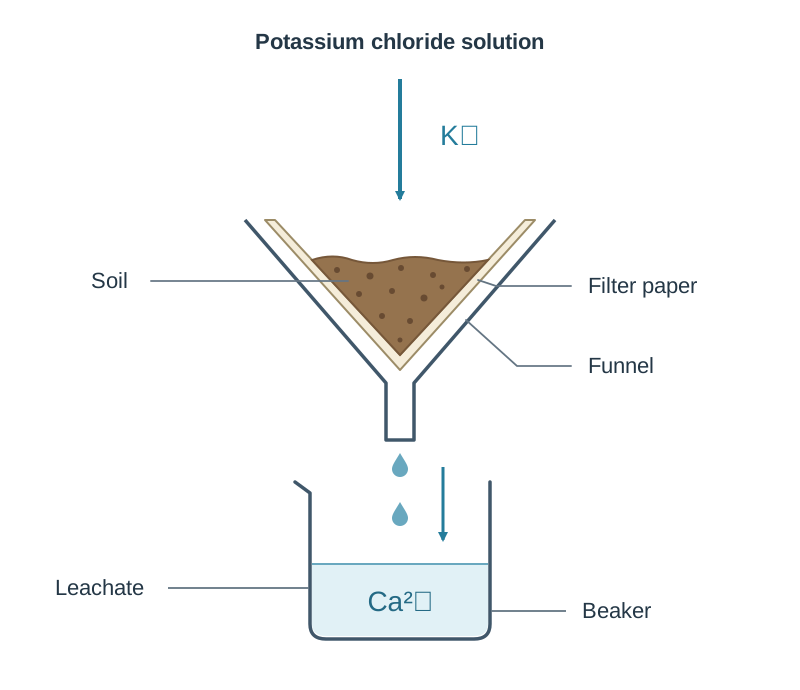
Results and calculation A white precipitate forms upon adding ammonium oxalate, confirming that calcium ions were displaced from soil colloids by potassium ions. Alternatively, pouring methylene blue dye onto soil followed by potassium chloride displaces the dye, yielding a blue leachate. Soils with higher clay or humus content demonstrate a higher cation exchange capacity.
Accuracy and safety Pour solutions slowly to avoid channelling along the filter paper edge. Potassium chloride solution irritates eyes; rinse splashes immediately with clean water.
How it is asked Has been asked to describe an investigation of soil cation exchange capacity (adding soil to funnel, adding potassium chloride, collecting leachate, testing for calcium with ammonium oxalate, noting white precipitate).
Showing flocculation in soil
Aim Demonstrate how different chemical substances cause clay particles to clump together and settle out of suspension.
Apparatus and materials Clay soil, deionised water, test tubes, bungs, lime (calcium hydroxide), calcium chloride, aluminium chloride, sodium chloride.
Method
- Add equal amounts of clay soil (e.g. 5 g) to each test tube.
- Add equal volumes of deionised water to each tube, keeping one as an untreated control.
- Add a different named reagent to each remaining tube: lime, calcium chloride, aluminium chloride, or sodium chloride.
- Stopper and shake each tube thoroughly.
- Leave all tubes to stand for a set time and record which suspension settles fastest.
Results and calculation Tubes containing aluminium chloride, calcium chloride, or lime settle fastest, leaving a clear liquid at the top. Sodium chloride settles very slowly, and the water control remains turbid. Multivalent cations neutralise negative charges on clay colloids, causing flocculation.
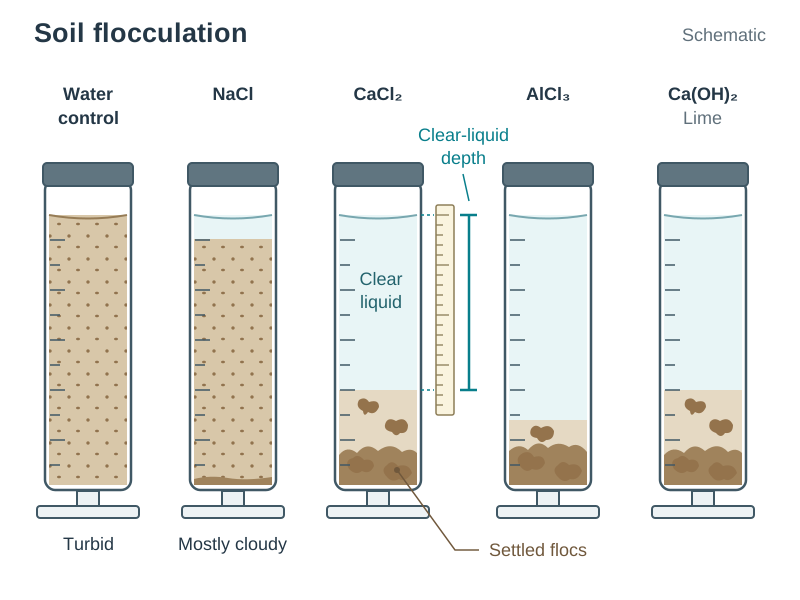
Accuracy and safety Shake all tubes equally and start timing together to ensure a fair test. Lime is caustic; avoid skin contact.
How it is asked Has been asked to describe with a labelled diagram an investigation to show flocculation (adding soil to tubes, adding named reagents like lime or calcium chloride, water control, shaking, and recording which settles faster).
Determining the pH of a soil
Aim Determine the pH of a soil sample using indicator or a digital pH meter.
Apparatus and materials Soil sample, beaker, deionised water, stirring rod, funnel, filter paper, universal indicator (or digital pH meter), colour chart.
Method
- Place an air-dried soil sample into a clean beaker.
- Add deionised water and stir thoroughly with a glass rod.
- Filter the suspension using a funnel and filter paper (or allow to settle using barium sulphate as a flocculant).
- Add universal indicator drops to the clear filtrate (or insert a calibrated digital pH probe).
- Compare the filtrate colour to a pH colour chart (or read the value directly from the digital meter).
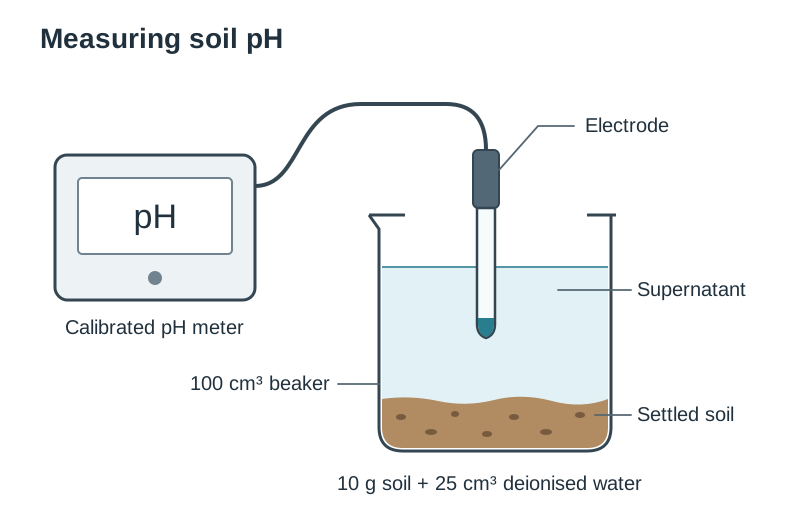
Results and calculation The colour or digital display gives the soil pH. Most agricultural crops and grassland thrive between pH 6.0 and 7.0.
Accuracy and safety Use deionised water rather than tap water, which contains dissolved minerals that alter pH. A calibrated digital pH probe provides greater accuracy than universal indicator.
How it is asked Has been asked to describe how to test soil pH with a diagram, state the optimum pH for barley (6.0–7.0) and the optimum soil pH for crop growth (5.5–7.5), and name a digital pH probe as a more accurate method.
Soil texture by sedimentation
Aim Determine the percentages of sand, silt, and clay in a soil sample by sedimentation.
Apparatus and materials Dried soil, graduated cylinder, deionised water, dispersing agent (Calgon), stopper, ruler.
Method
- Place a dried soil sample into a graduated cylinder.
- Add water and a chemical dispersing agent (Calgon).
- Stopper the cylinder and shake thoroughly to suspend all particles.
- Leave the cylinder undisturbed to settle for several hours or overnight.
- Measure the height of each settled layer (sand at bottom, silt in middle, clay on top) and total sediment height.
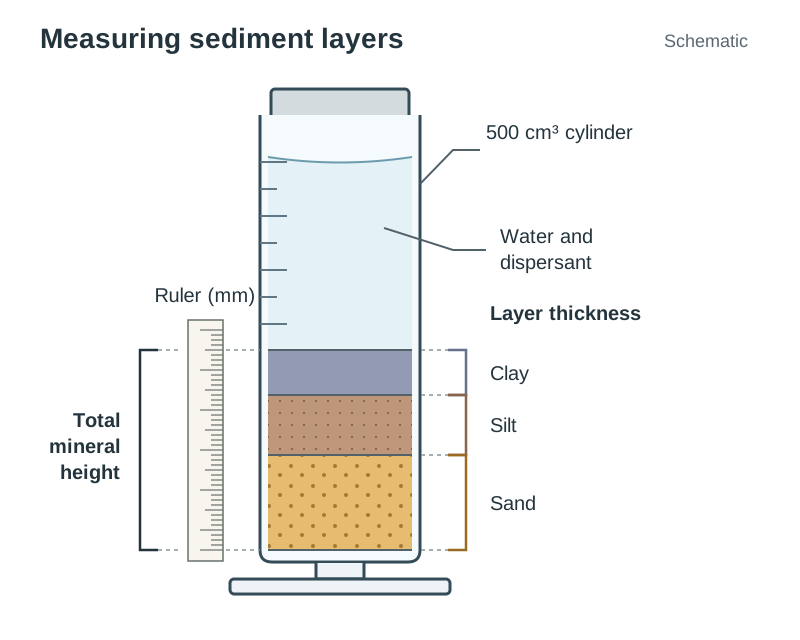
Results and calculation Particles settle by size and mass: sand settles first, silt second, and clay remains in suspension longest before settling on top. Calculate: % fraction = (layer height / total height) × 100. Use a soil texture triangle to classify the soil.
Accuracy and safety Add a chemical dispersant so clay colloids do not aggregate and settle prematurely with silt. Read graduations at eye level to avoid parallax error.
How it is asked Has been asked to describe sedimentation to determine soil texture, state sources of error (not reading from the meniscus), and use the soil triangle to find soil type.
Soil texture using a soil sieve
Aim Determine the particle size distribution of a soil sample using a nest of sieves.
Apparatus and materials Dry soil sample, pestle and mortar, graded sieves, collection pan, electronic balance.
Method
- Dry the soil sample and crush clods gently with a pestle and mortar.
- Weigh the total dry soil sample on an electronic balance.
- Stack sieves in descending order with the largest mesh on top and receiving pan at the bottom.
- Pour the sample into the top sieve and shake thoroughly.
- Weigh the soil fraction retained on each sieve and in the pan.
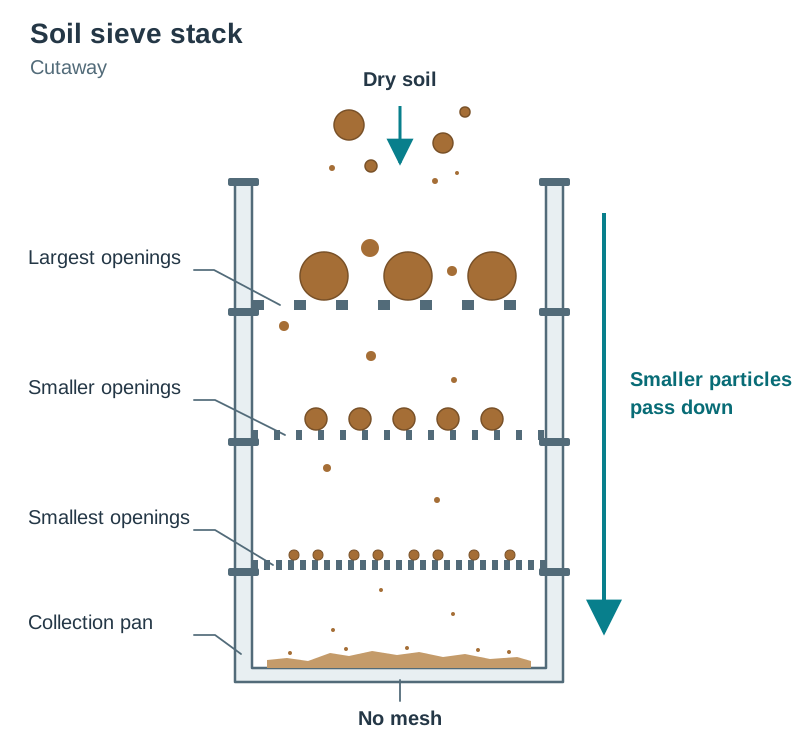
Results and calculation Coarse sand remains on upper sieves, medium and fine sand on middle sieves, and silt/clay passes into the bottom pan. Calculate: % fraction = (mass in sieve / total dry mass) × 100. Plot percentages on a soil triangle to determine texture.
Accuracy and safety The soil must be completely dry before sieving so particles do not clump together. Calibrate the electronic balance beforehand to prevent zero errors.
How it is asked Has been asked to describe sieving (dry sample, crush, weigh, stack largest on top, shake, weigh sieves, calculate percentages, use soil triangle) and relate results to tillage suitability.
Soil texture by hand testing
Aim Estimate the texture class of a soil sample using feel and manipulation.
Apparatus and materials Soil sample, water wash bottle.
Method
- Rub a small dry soil sample between fingers and thumb, noting grittiness or smoothness.
- Moisten the soil sample gradually with water.
- Knead and rub the moist sample between fingers and thumb, noting stickiness and plasticity.
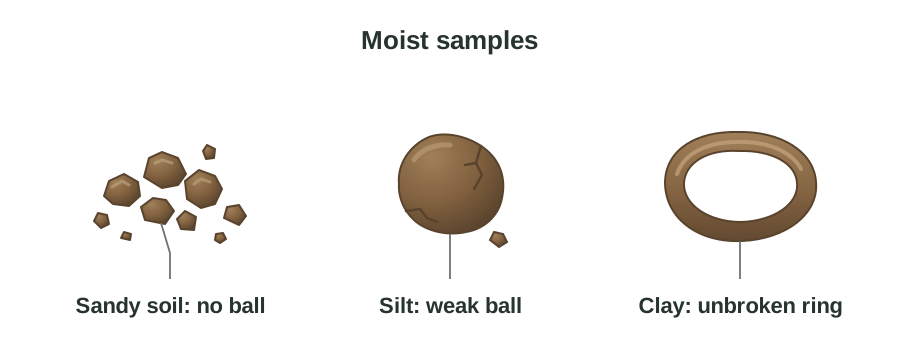
- Roll the moist soil into a ball, then into a thread.
- Bend the thread into a ring or horseshoe shape.
Results and calculation Sandy soil feels gritty and cannot form a ball. Silt feels silky or soapy and forms a weak ball. Clay feels sticky, takes a polish, rolls into a thin thread, and bends into a ring without breaking.
Accuracy and safety Add water drop by drop; adding too much water creates a slurry that masks texture. Wash hands thoroughly with soap after handling soil.
How it is asked Has been asked as an alternative method to determine soil texture, crediting rubbing dry and wet soil, checking grittiness/stickiness/plasticity, rolling into threads or rings, and identifying errors like failing to roll into a ball.
Capillarity and infiltration rate of compacted and uncompacted soil
Aim Compare the capillarity and infiltration rate of compacted and uncompacted soil.
Apparatus and materials Two open-ended glass tubes, cotton wool, retort stands, water trough, funnels, filter paper, beakers, stopwatch, ruler, dry soil.
Method
- Plug the bottoms of two open-ended tubes with cotton wool.
- Place equal masses of soil into both tubes, packing one firmly (compacted) and leaving the other loose (uncompacted).
- For capillarity: stand both tubes in equal depths of water and record the height water rises after a set time.
- For infiltration: place equal masses of compacted and uncompacted soil in funnels with filter paper over beakers.
- Pour equal volumes of water onto each and record the time taken to drain or volume of filtrate collected.
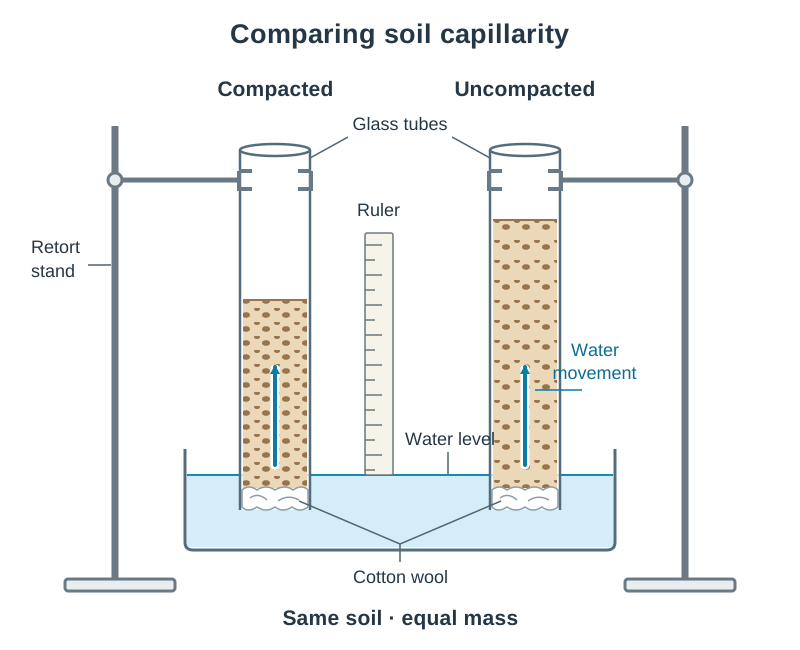
Results and calculation Capillarity: water initially rises faster in uncompacted soil, but compacted soil reaches a greater final height due to narrower pore spaces. Infiltration: water drains faster through uncompacted soil because of larger pore spaces.
Accuracy and safety Use equal masses of the same soil and identical tubes for a fair test. Record heights with a ruler and time with a stopwatch.
How it is asked Has been asked to compare capillarity with a labelled diagram, identify independent/dependent/control variables, outline ways to improve accuracy (electronic balance, ruler), and state predictions.
Percentage water content of a soil sample
Aim Determine the percentage water content of a soil sample by oven drying.
Apparatus and materials Fresh soil sample, evaporating basin, electronic balance, drying oven (105 °C), desiccator, tongs.
Method
- Weigh a clean, dry evaporating basin on an electronic balance ().
- Add fresh soil and record the combined mass ().
- Place the basin and soil into an oven set at 105 °C.
- Dry the sample, cool in a desiccator, and reweigh.
- Repeat heating and cooling until a constant mass is reached ().
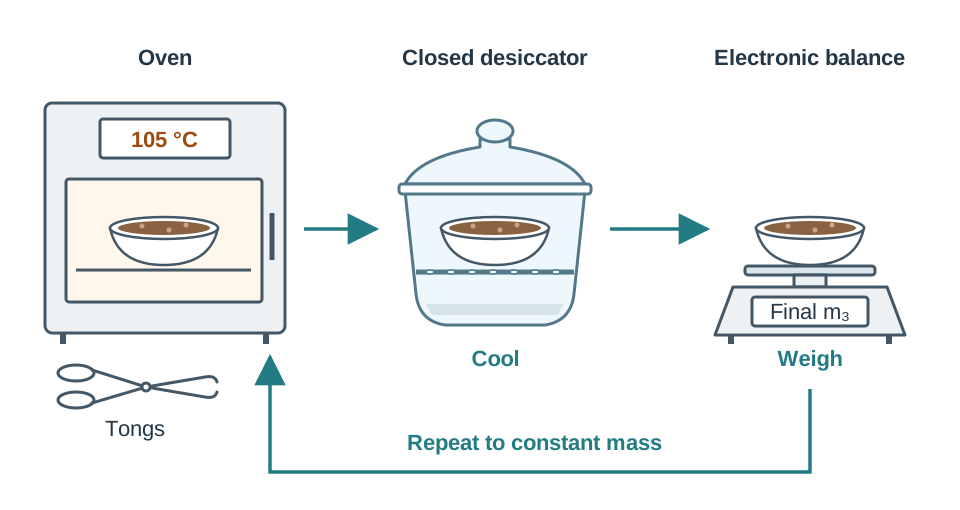
Results and calculation Mass of fresh soil = . Mass of water lost = . Formula: % Water = [(mass of water lost) / (mass of fresh soil)] × 100 = [() / ()] × 100. High soil water content indicates saturation or field capacity.
Accuracy and safety Maintain oven temperature strictly at 105 °C so organic matter does not burn off and give false water loss. Cool in a desiccator to prevent dry soil reabsorbing atmospheric moisture.
How it is asked Has not come up directly in the supplied papers; a question would reasonably ask for the recorded masses, calculation formula, heating to constant mass, and temperature control precautions.
Isolating and growing bacteria from clover root nodules
Aim Isolate and culture Rhizobium bacteria from the root nodules of white clover.
Apparatus and materials Clover roots with nodules, nutrient agar plate, mild bleach (Milton) or alcohol, sterile water, inoculating loop, Bunsen burner, glass rod, incubator.
Method
- Wash soil off clover roots and cut off a large, pinkish nodule.
- Surface-sterilise the nodule in mild bleach (Milton) or alcohol, then rinse in sterile water.
- Crush the nodule with a sterile glass rod in a dish.
- Flame an inoculating loop until red hot and allow it to cool.
- Dip the loop into the crushed nodule and streak across a nutrient agar plate.
- Invert and incubate the plate at 20–30 °C for several days.
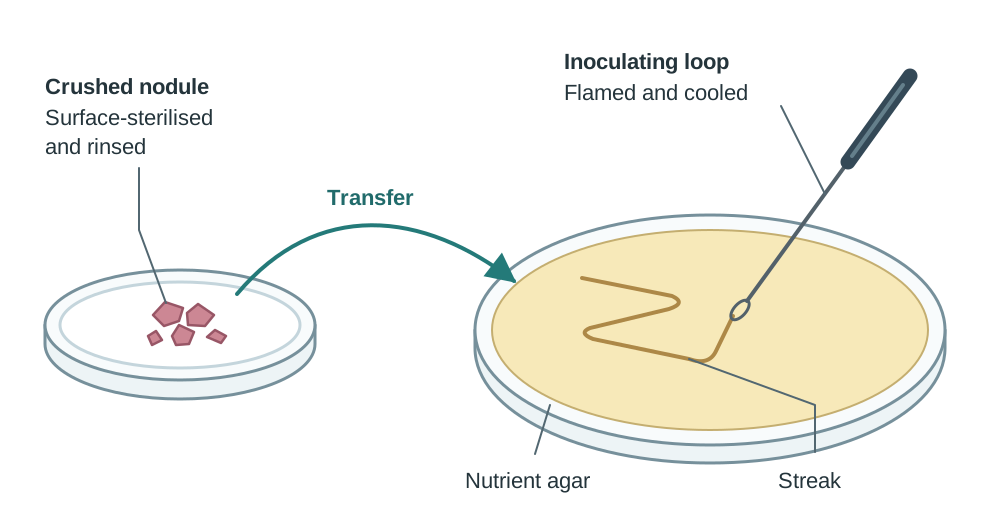
Results and calculation Shiny white or translucent bacterial colonies of Rhizobium develop along the streak lines. The pink nodule interior indicates active nitrogen fixation.
Accuracy and safety Surface-sterilise the nodule so only internal bacteria grow. Flame the inoculating loop to prevent airborne contamination. Incubate at 20–30 °C, never 37 °C, to prevent growing human pathogens.
How it is asked Has been asked to describe with a labelled diagram how to isolate and grow bacteria from clover root nodules, crediting washing roots, sterilising surface, crushing, flaming loop, streaking agar, and incubating at 20–30 °C.
Percentage organic matter and organic carbon in soil
Aim Determine the percentage organic matter in soil by loss on ignition and convert to organic carbon.
Apparatus and materials Oven-dried soil, crucible and lid, pipeclay triangle, tripod, Bunsen burner, electronic balance, desiccator, tongs.
Method
- Weigh a clean crucible and lid ().
- Add oven-dried soil (dried at 105 °C) and record the mass ().
- Heat strongly with a Bunsen burner on a pipeclay triangle for 20–30 minutes with the lid slightly ajar.
- Cool in a desiccator and weigh.
- Repeat heating and cooling until constant mass is reached ().
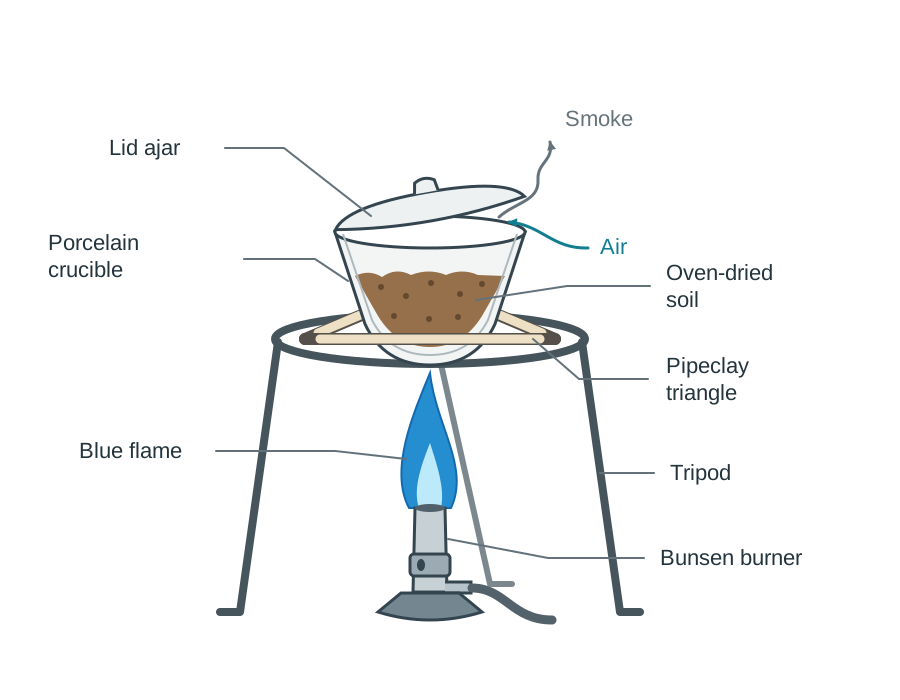
Results and calculation Mass of dry soil = . Mass of organic matter combusted = . Formula: % SOM = [() / ()] × 100. Convert to organic carbon: % SOC = % SOM × 0.58. Soils with high organic matter have better structure and fertility.
Accuracy and safety Soil must be oven-dried at 105 °C first so mass loss reflects organic matter, not water. Keep lid ajar during heating to admit oxygen, but cool with lid on in a desiccator.
How it is asked Has not come up directly in the supplied papers; a question would reasonably ask for the formula, heating to constant mass, converting to organic carbon (× 0.58), and why pre-drying is necessary.
Earthworm activity and number in a pasture
Aim Demonstrate earthworm burrowing activity and estimate earthworm numbers in pasture.
Apparatus and materials Perspex container, sand, soil, leaves, quadrat (0.5 m × 0.5 m), mustard powder, water (or spade and plastic sheet).
Method
- Activity: fill a perspex container with alternating layers of sand and soil, place leaves on top, add worms, cover with dark card, and observe layer mixing after one week.
- Population: place a quadrat randomly in a pasture field.
- Mix mustard powder in water and pour evenly over the quadrat area.
- Collect and count earthworms as they emerge at the surface.
- Alternatively, dig a soil block (20 cm × 20 cm × 20 cm) and hand-sort worms onto a plastic sheet.
- Repeat several times and calculate the average.
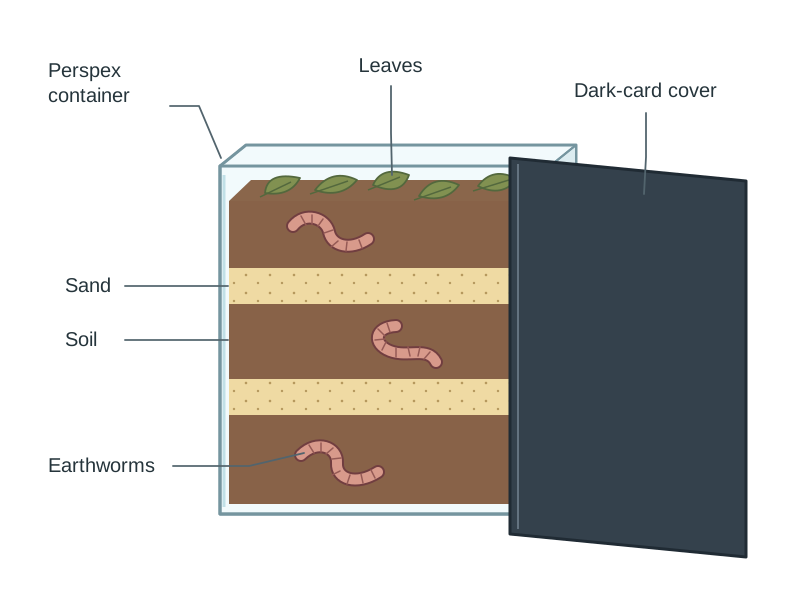
Results and calculation Wormery layers become mixed and burrows form, showing earthworms mix and aerate soil. Population: Earthworms per m² = count per 0.25 m² quadrat × 4. High numbers indicate fertile, aerated soil.
Accuracy and safety Sample when soil is warm and moist, avoiding dry or frosty conditions. Mustard irritates worm skin; rinse collected worms in clean water before returning them to soil.
How it is asked Has been asked in connection with fertiliser trials measuring earthworm populations. A question would reasonably ask for the quadrat/mustard method, calculating density per m², and benefits to soil structure.
Effect of weather and soil conditions on percentage germination
Aim Investigate the effect of temperature and soil moisture on seed germination.
Apparatus and materials Seeds (barley), seed trays, potting compost or soil, water, refrigerator, warm room.
Method
- Fill matching seed trays with equal amounts of soil.
- Sow an equal number of seeds (e.g. 50 or 100) at the same depth in each tray.
- Add equal amounts of water to two trays; place one in a fridge (cold) and one at room temperature (warm).
- For soil conditions: set up an extra tray with waterlogged soil and one with dry soil at room temperature.
- Leave for 1 to 2 weeks, keeping conditions steady.
- Count the number of germinated seeds in each tray.
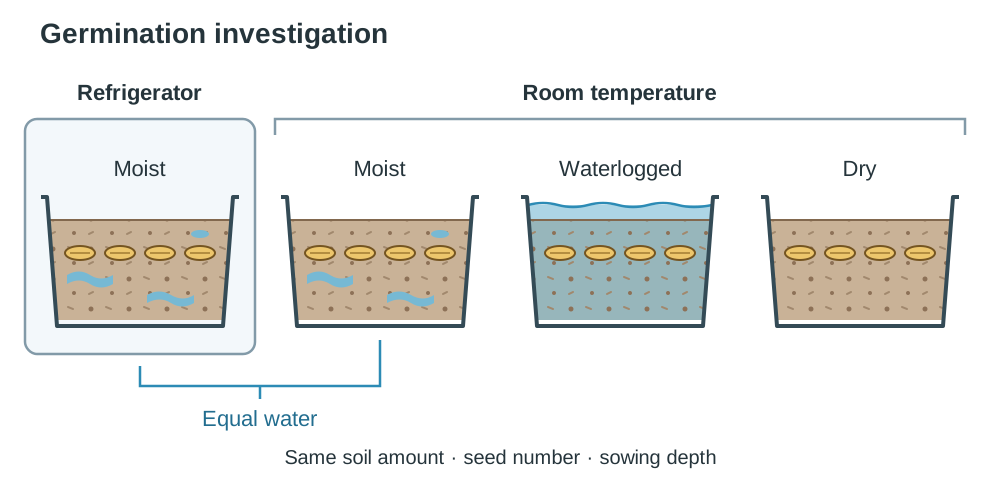
Results and calculation Calculate: % Germination = (number of germinated seeds / total seeds sown) × 100. Results are quantitative. Germination is highest in warm, moist soil. Cold halts or delays germination; waterlogging deprives seeds of oxygen.
Accuracy and safety Sow seeds at the same depth and keep seed numbers and soil types identical so only temperature or moisture varies.
How it is asked Has been asked to describe how to investigate soil temperature on germination (two trays, equal seeds/water, fridge vs room temperature, count germinated seeds), state that results are quantitative, and explain how results guide sowing dates.
Plant uniformity from certified and uncertified seed
Higher level only.
Aim Compare the uniformity of crops grown from certified and uncertified seed.
Apparatus and materials Certified seed, uncertified seed, two equal seedbeds or containers, soil, ruler.
Method
- Prepare two identical seedbed plots or containers with the same soil.
- Sow equal numbers or masses of certified seed in Plot 1 and uncertified seed in Plot 2 at the same depth.
- Give both plots equal water, light, and nutrients.
- Grow plants under identical conditions until heading or maturity.
- Measure plant heights at regular intervals using a ruler.
- Observe leaf and stem structure, colour uniformity, and presence of weeds.
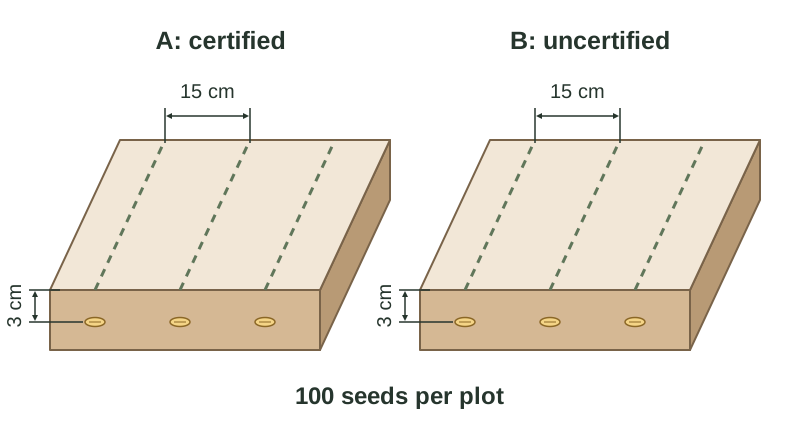
Results and calculation Certified seed displays ≥85% germination, uniform plant height, uniform colour, synchronous ripening, and no weeds. Uncertified seed displays <85% germination, variable plant heights, patchy colour, uneven ripening, and weeds.
Accuracy and safety Standardise seedbed preparation and watering so seed quality is the only variable affecting plant uniformity.
How it is asked Has been asked to describe a field trial to distinguish certified and uncertified seed with a diagram (equal plots/seeds, identical conditions, measuring height, observing colour/maturity) and list distinguishing characteristics.
Establishment of grass compared with one other crop
Higher level only.
Aim Compare the establishment rate and seedling vigour of grass and spring barley.
Apparatus and materials Perennial ryegrass seed, spring barley seed, prepared seedbed plots or trays, ruler, quadrat.
Method
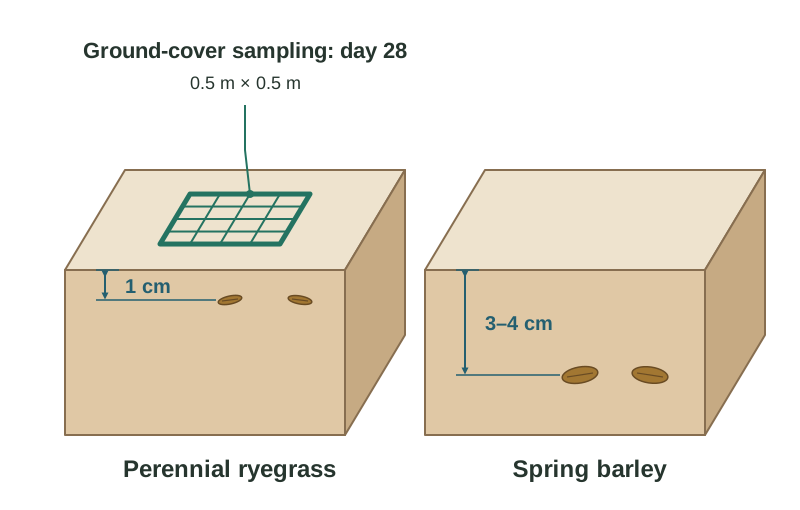
- Prepare two adjacent seedbed plots with identical soil fertility and tilth.
- Sow grass seeds in Plot 1 shallowly (1 cm) and barley seeds in Plot 2 deeper (3–4 cm).
- Roll the grass plot for firm soil contact and harrow the barley lightly.
- Give both plots identical watering and ambient conditions.
- Record the days to first green shoot emergence in each plot.
- Count established seedlings per unit area after 2 to 4 weeks using a quadrat.
Results and calculation Barley emerges faster (5–7 days) with robust shoots due to large endosperm food reserves. Grass emerges more slowly (10–14 days) with slender shoots. Calculate: % Establishment = (number of established plants / viable seeds sown) × 100.
Accuracy and safety Sow each seed at its correct depth; burying small grass seeds too deeply exhausts their energy reserves before emergence.
How it is asked Has not come up directly in the supplied papers; a question would reasonably ask for the method, variables kept constant, the difference in emergence times, and the influence of seed size.
Botanical composition of an old permanent pasture or a new ley
Aim Determine and compare the plant species present in an old permanent pasture and a new ley.
Apparatus and materials Quadrat (e.g. 0.5 m × 0.5 m), plant identification key, recording sheet.
Method
- Throw a pen or marker at random in the pasture.
- Place a quadrat where the marker lands.
- Identify all plant species rooted inside the quadrat using an identification key.
- Record the presence of each species.
- Repeat the procedure at least 10 times across the field.
- Repeat the survey in the contrasting pasture.
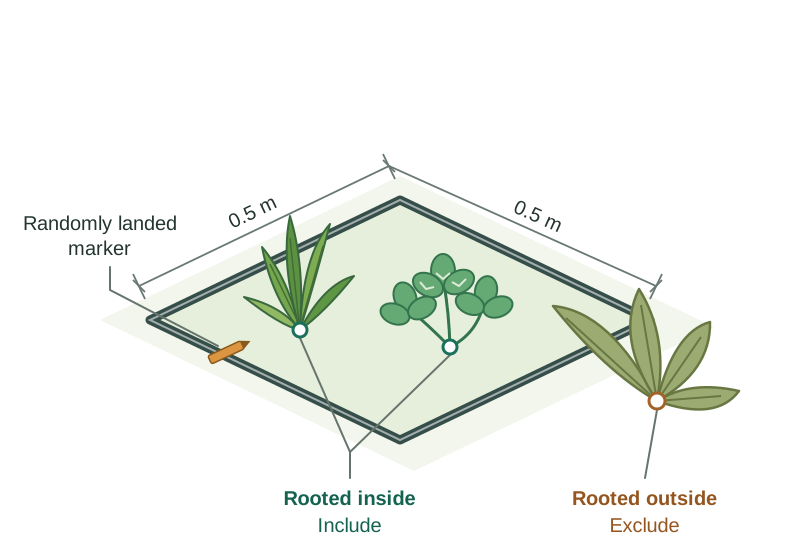
Results and calculation Identifying which species are present is qualitative data (the types of plants present); counting the quadrats in which a species occurs gives a numerical percentage frequency. New leys are dominated by perennial ryegrass and clover (>85%). Old pastures have higher diversity but more weeds (dandelions, buttercups, thistles). Calculate: % Frequency = (quadrats containing species / total quadrats) × 100.
Accuracy and safety Throw markers randomly to avoid bias towards noticeable flowering plants. Repeat at least 10 times for representative sampling. Wear gloves when handling weeds like ragwort.
How it is asked Has been asked to describe how to investigate botanical composition (throw at random, place quadrat, repeat 10 times, identify with key, record), state why data is qualitative, and identify grassland plants.
Effect of nutrients on plant growth and biomass
Aim Investigate the effect of mineral deficiencies on plant growth and dry biomass.
Apparatus and materials Seedlings (barley), boiling tubes, Sachs nutrient solutions (complete control, minus N, minus P, minus Mg), cotton wool, tin foil, drying oven, balance.
Method
- Set up boiling tubes with Sachs solutions: complete control and deficient solutions (minus N, minus P, minus Mg).
- Wrap tubes in tin foil to exclude light and stop algae growth.
- Place an equal seedling in each tube, held by cotton wool.
- Aerate solutions regularly and top up with deionised water.
- Grow seedlings under identical light and temperature for 2 to 3 weeks.
- Observe deficiency symptoms, separate roots and shoots, dry in an oven, and weigh.
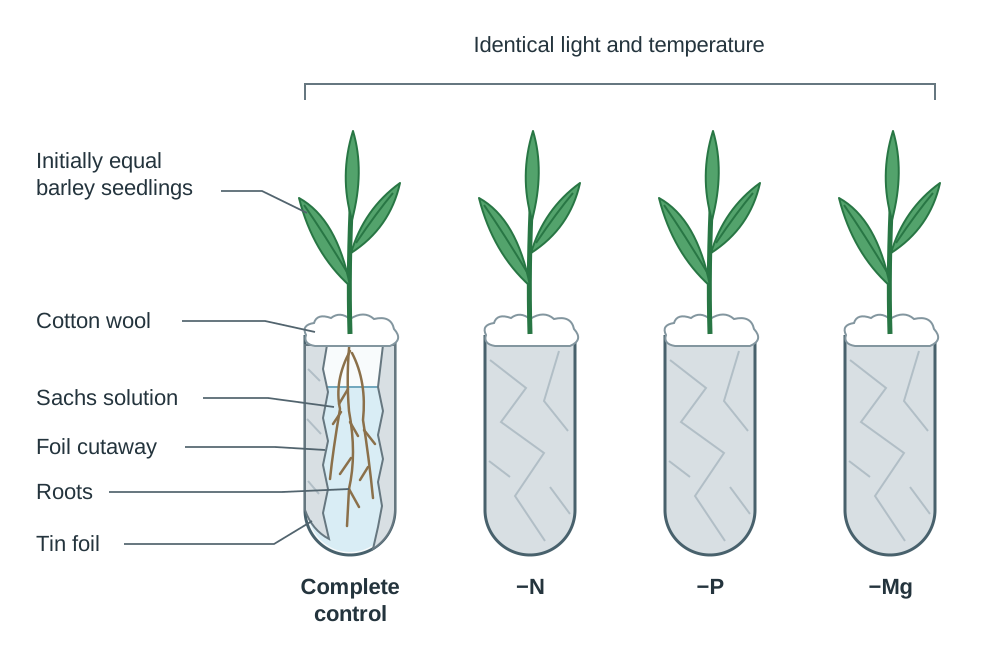
Results and calculation Complete solution yields healthy, vigorous growth. Minus N produces stunted plants with yellow leaves. Minus P causes purplish leaves and poor root development. Minus Mg causes chlorosis (yellowing between veins). Deficiencies significantly reduce dry biomass.
Accuracy and safety Cover tubes in foil so light does not stimulate algal growth that takes up nutrients. Aerate roots so they can respire.
How it is asked Has been asked to describe an experiment showing mineral deficiency (complete vs deficient solution, aerating, wrapping in foil, same conditions, observing deficiency signs like chlorosis).
Dry matter content of a named crop
Aim Determine the percentage dry matter (% DM) in a fresh sample of grass.
Apparatus and materials Fresh grass, shears, container (beaker or dish), electronic balance, drying oven (100 °C) or microwave, desiccator, tongs.
Method
- Cut a sample of fresh grass and chop it into short pieces.
- Record the mass of a clean, dry container on an electronic balance ().
- Add chopped grass to the container and record the mass ().
- Place in an oven at 100 °C (or microwave at short intervals).
- Cool in a desiccator, reweigh, and repeat until constant mass is reached ().
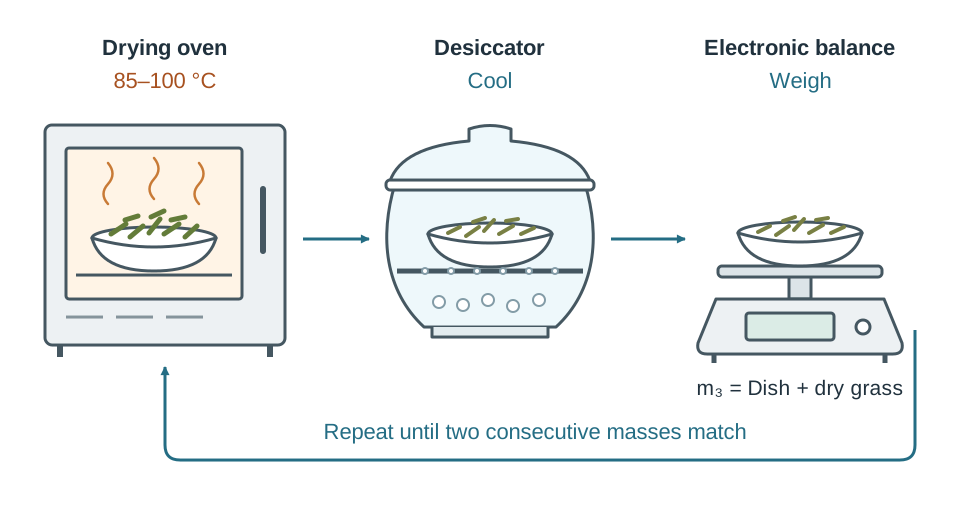
Results and calculation Mass of fresh grass = . Mass of dry grass = . Formula: % DM = [(mass of dry grass) / (mass of fresh grass)] × 100 = [() / ()] × 100. Fresh grass is typically 16–20% DM.
Accuracy and safety Dry to constant mass to ensure all water is removed. Keep oven at 100 °C to avoid charring organic matter. Calibrate the balance beforehand.
How it is asked Has been asked to describe determining % DM of grass (weigh container, add grass, dry at 100 °C, reweigh to constant mass, calculate % DM), name systematic errors (uncalibrated balance, wrong oven temperature), and calculate DM yield per hectare.
Genetic inheritance of a trait by hybridising two varieties
Aim Investigate genetic inheritance of flower colour by cross-pollinating two plant varieties.
Apparatus and materials Pure-breeding purple-flowered and white-flowered plants, scalpel or forceps, paintbrush, paper bag, pots, compost.
Method
- Remove anthers containing pollen from the purple flower with a sterile scalpel.
- Remove anthers from the white flower before pollen sheds, leaving only the carpel (emasculation).
- Rub pollen from the purple flower onto the stigma of the white flower.
- Cover the pollinated flower with a paper bag to prevent unwanted pollination.
- Collect mature seeds and sow them to produce offspring.
- Count the number of plants with purple flowers and white flowers.
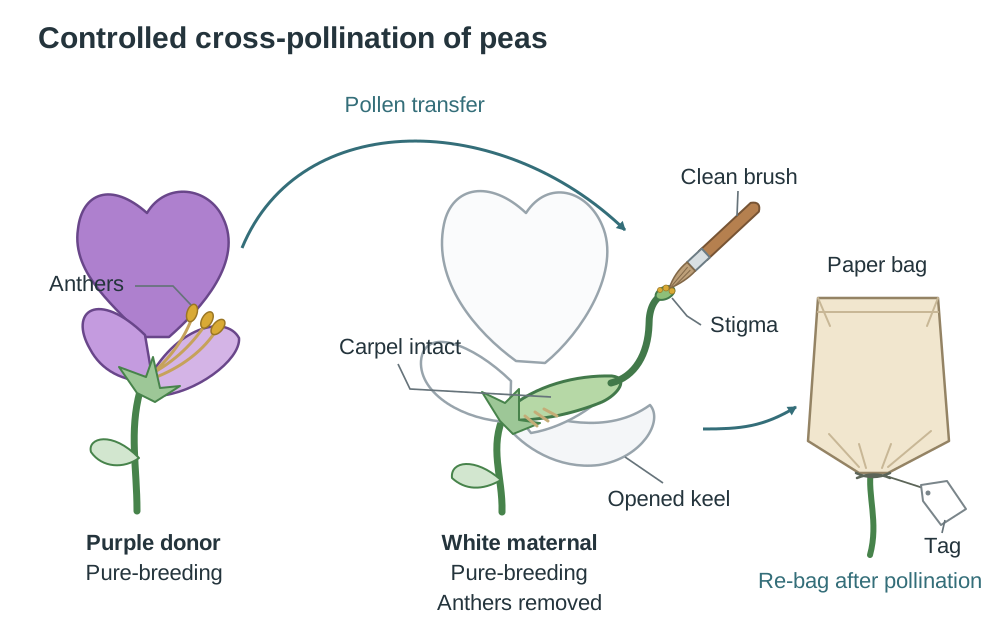
Results and calculation All F1 plants show purple flowers, demonstrating purple is the dominant trait. In the F2 generation, traits segregate in an approximate 3:1 ratio (purple to white).
Accuracy and safety Emasculate the female flower before its own anthers mature to prevent self-pollination. Cover the flower with a bag to exclude foreign pollen.
How it is asked Has been asked to sequence cross-pollination steps (emasculating female flower, collecting pollen, rubbing on stigma, collecting seeds) and identify the dominant trait from offspring counts.
Quality of a sample of milk over time
Aim Evaluate milk hygiene quality over time using the resazurin dye reduction test.
Apparatus and materials Milk samples (stored at 4 °C vs room temperature 20 °C), test tubes, bungs, resazurin solution, water bath (37 °C), colour chart, timer.
Method
- Take milk samples stored under different conditions (refrigerated at 4 °C vs room temperature) over several days.
- Add 10 cm³ of milk to a sterile test tube.
- Add 1 cm³ of resazurin solution, stopper the tube, and invert to mix.
- Place the tube in a water bath at 37 °C in the dark.
- Incubate for a set time (e.g. 10 to 60 minutes).
- Observe colour changes against a standard colour chart.
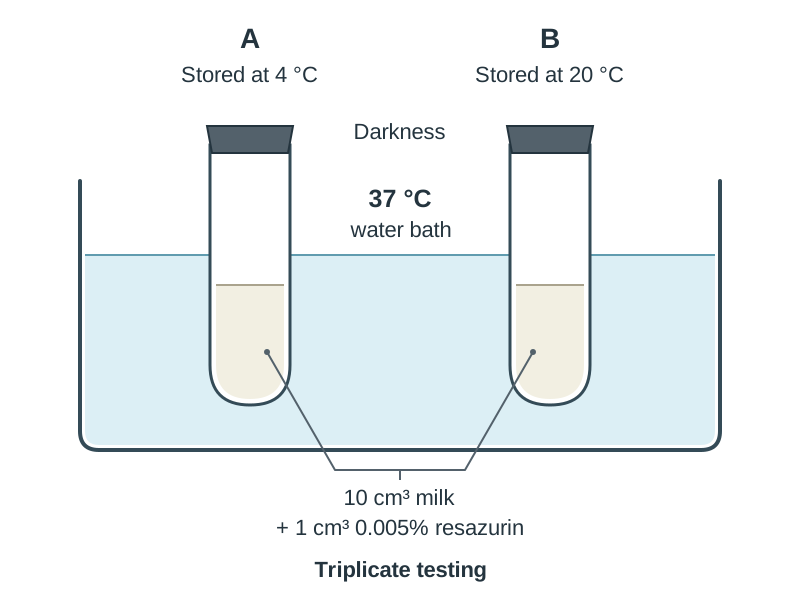
Results and calculation Fresh refrigerated milk stays blue or lilac (good quality, low bacteria). Milk kept at room temperature turns pink or white/decolourised (poor quality, high bacterial count). Respiring bacteria consume oxygen, reducing the dye.
Accuracy and safety Use sterile equipment to avoid introducing foreign bacteria. Keep tubes in darkness during incubation because light reduces resazurin independently. Do not consume tested milk.
How it is asked Has not come up directly as a resazurin method in the supplied papers, but milk quality questions ask for CMT testing steps, storing milk below 4 °C, and factors affecting bacterial counts (TBC).
Key terms
- Independent variable
- The single factor deliberately altered or manipulated across treatments in an investigation.
- Dependent variable
- The factor that is measured or observed to evaluate the effect of the independent variable.
- Controlled variable
- Any factor kept strictly identical across all test groups to ensure a fair test.
- Qualitative data
- Descriptive observations that do not involve numerical measurements, such as plant species present or colour changes.
- Quantitative data
- Numerical measurements or counts obtained using calibrated instruments, such as seed counts or soil masses.
- Cation exchange capacity (CEC)
- The ability of negatively charged soil colloids (clay and humus) to hold and exchange mineral cations in solution.
- Flocculation
- The clumping together of microscopic clay particles into larger clusters or aggregates, promoted by polyvalent cations like calcium.
- Capillarity
- The spontaneous upward movement of water through narrow soil pore spaces against gravity.
- Infiltration rate
- The speed at which water enters and drains downwards through the soil surface and pore spaces.
- Constant mass
- The state where consecutive drying and weighing cycles produce identical readings, confirming complete removal of water or organic matter.
- Certified seed
- Officially tested seed with guaranteed high varietal purity, minimum 85% germination, and freedom from disease and weed seeds.
- Dry matter (% DM)
- The percentage of plant or feed material remaining after all moisture has been completely evaporated.
Check yourself
What observation confirms the presence of displaced calcium ions in the cation exchange experiment?
A white precipitate forms upon adding ammonium oxalate solution to the collected leachate.
Which multivalent cation causes faster clay flocculation: sodium (Na+) or aluminium (Al3+), and why?
Aluminium (Al3+); trivalent cations carry three positive charges, neutralising the negative surface charges on clay colloids far more effectively than monovalent sodium (Na+).
In what vertical order do sand, silt, and clay settle during a soil sedimentation experiment?
Sand settles first at the bottom, silt forms the middle layer, and clay settles last on top.
What oven temperature must be used when drying soil to determine water content?
100 °C to 105 °C, ensuring water evaporates without scorching organic matter.
State two characteristics observed in a field trial that confirm a crop was grown from certified seed.
Uniform plant height and colour, alongside high germination (≥85%) and an absence of weeds.
Why must clover root nodules be surface-sterilised before isolating Rhizobium bacteria?
To kill surface microorganisms living on the outside of the nodule so only internal Rhizobium bacteria grow on the agar.
A 200 g fresh grass sample leaves 36 g of dry matter after drying to constant mass. Calculate the % DM.
% DM = (36 g / 200 g) × 100 = 18.0%.