

Marginal costing and Cost-Volume-Profit (CVP) analysis examine how changes in activity levels directly affect costs, revenues, and net profit. Rather than absorbing fixed manufacturing overheads into unit product costs, marginal costing separates costs strictly by behaviour into fixed and variable components. Contribution represents the revenue remaining after variable costs to cover fixed overheads and generate net profit. For Leaving Certificate Higher Level Accounting, you must be confident separating mixed costs with the high-low method, preparing marginal costing statements, calculating break-even points and margins of safety, plotting break-even charts, and handling multi-variable sensitivity scenarios.
Cost Behaviour and the High-Low Method
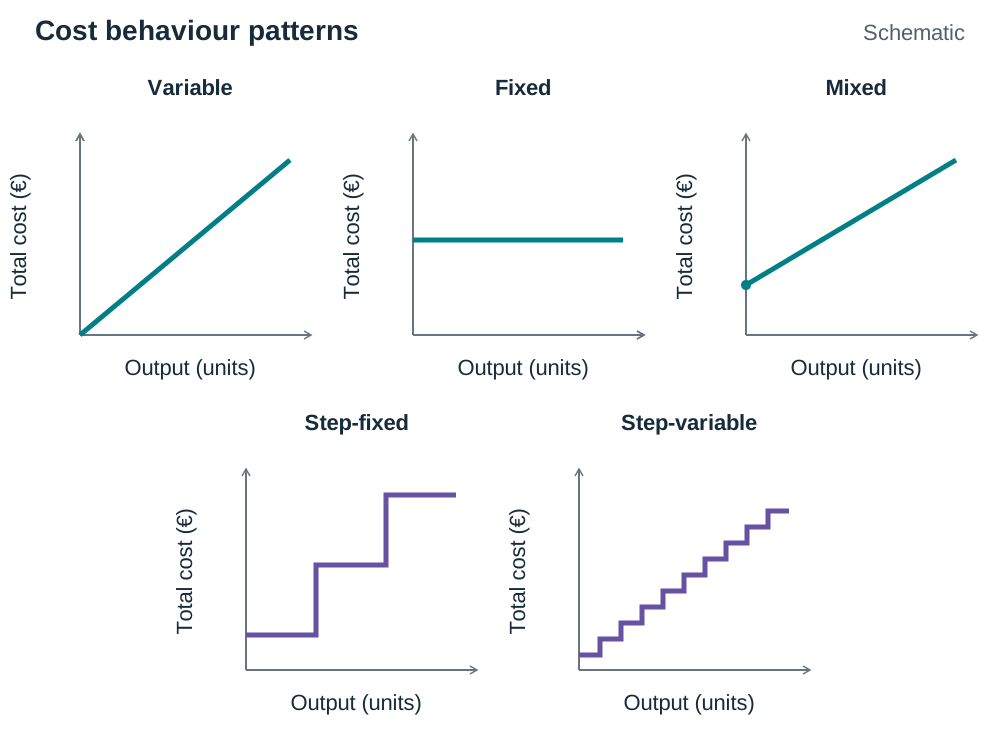
Financial accounting typically classifies costs by function, such as administration, selling, or production. Marginal costing classifies costs strictly by how they behave when output changes:
- Variable costs: Change in direct proportion to production volume. Examples include raw materials and direct wages. Variable cost per unit remains constant, but total variable cost climbs as output rises.
- Fixed costs: Remain unchanged in total over a given period, regardless of production volume, within a normal operating range. Examples include factory rent, commercial rates, and managerial salaries.
- Mixed (semi-variable) costs: Contain both a fixed standing charge and a variable usage charge. Factory light and heat or telephone expenses are typical examples.
- Step-fixed costs: Remain fixed over a specific band of activity, then jump abruptly to a higher fixed tier when a capacity threshold is breached, such as hiring an additional factory supervisor.
- Step-variable cost: A variable cost that rises in small steps rather than smoothly as output increases. For example, packaging bought in cartons of 500 units jumps each time another carton is opened, though over a wide range it behaves like a variable cost. Step-fixed costs jump in large steps; step-variable costs rise in many small increments.
- Controllable and uncontrollable costs: Controllable costs can be directly regulated by a departmental budget manager (such as material wastage or overtime in the manager's own department). Uncontrollable costs cannot be adjusted by that manager in the short term, such as apportioned factory insurance or commercial rates.
Marginal costing principles also appear in flexible budget questions, where overheads must be adjusted to the actual activity achieved.
The High-Low Method
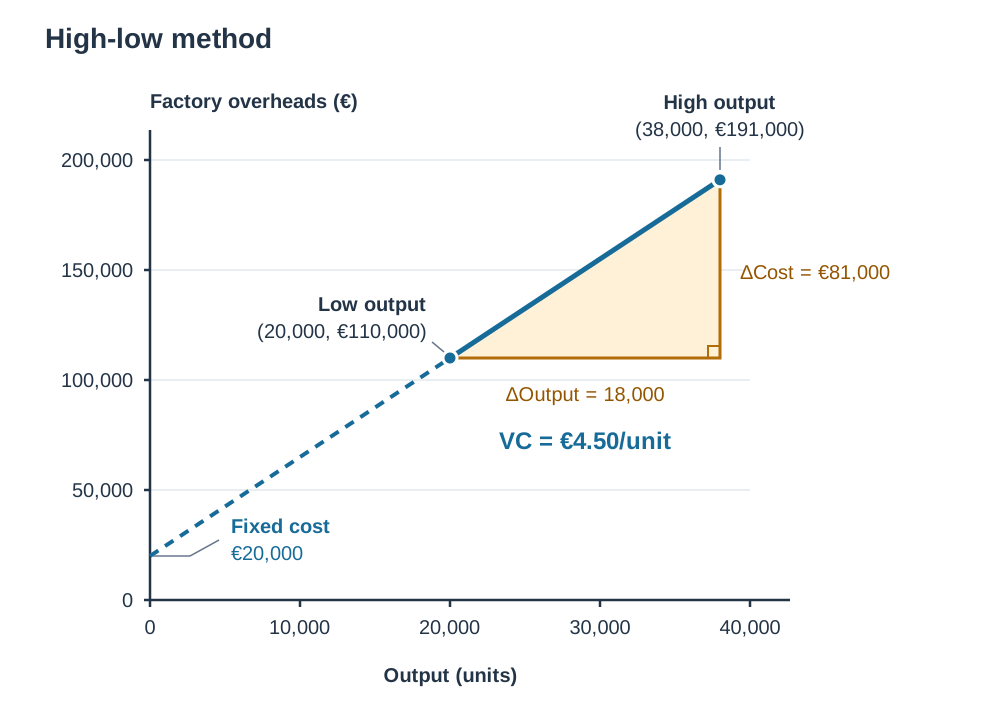
When an examination question presents costs at different activity levels, use the high-low method to separate the variable and fixed elements. Always select the high and low points based on activity level (units), not by cost:
Once the variable cost per unit is established, find the fixed cost by subtracting total variable costs from total costs at either level:
For example, if factory overheads are €191,000 at 38,000 units and €110,000 at 20,000 units:
Cross-check by calculating fixed costs at both activity levels:
- Using high activity: €191,000 − (38,000 × €4.50) = €191,000 − €171,000 = €20,000
- Using low activity: €110,000 − (20,000 × €4.50) = €110,000 − €90,000 = €20,000
Contribution and the Marginal Costing Statement
Contribution is the central figure in marginal costing. It measures the revenue remaining after variable costs to cover fixed overheads and generate net profit. Once fixed costs are fully covered, every additional euro of contribution adds directly to net profit.
Never mix up contribution and profit. Profit only emerges after total fixed overheads have been subtracted from total contribution.
The Standard Presentation Layout
Set out the statement clearly, for example in this layout:
| Item | Sub-calculations (€) | Total (€) |
|---|---|---|
| Sales Revenue (Units × SP) | X | |
| Less Variable Costs: | ||
| Direct Materials | X | |
| Direct Labour | X | |
| Variable Factory Overheads | X | |
| Variable Selling Expenses (Commission) | X | (X) |
| Contribution | X | |
| Less Fixed Costs: | ||
| Fixed Factory Overheads | X | |
| Fixed Administration Overheads | X | |
| Fixed Selling Expenses | X | (X) |
| Net Profit | X |
The Contribution to Sales (C/S) Ratio
The C/S ratio expresses contribution as a percentage of sales revenue:
A C/S ratio of 40% means that every €1.00 of sales generates €0.40 towards fixed costs and net profit. When dividing by the C/S ratio in formulas, always enter it as a decimal (0.40) rather than a whole percentage number (40).
Core CVP Formulas and Target Profit
Cost-Volume-Profit analysis applies contribution to operational decision-making.
1. Break-Even Point (BEP)
The break-even point is the output level where total revenues equal total costs, resulting in neither a profit nor a loss:
BEP in sales value can be found by multiplying break-even units by the selling price, or by dividing fixed costs by the C/S ratio as a decimal. Always show which method you used. Units needed for break-even or a target profit are always rounded up to the next whole unit.
2. Margin of Safety (MoS)
The margin of safety represents the buffer by which budgeted or actual sales exceed the break-even volume before losses begin:
3. Level of Sales Required for a Target Profit
When management sets a target profit, treat the profit as an additional commitment that contribution must cover:
4. Target Profit as a Percentage of Sales and Required Selling Price
When target profit is expressed as a percentage of sales, each unit sold must cover its variable cost and its percentage profit share. What remains covers fixed costs:
A reliable alternative is the sales equation, where is output quantity:
When solving for a required selling price with known volume and profit targets, set up the contribution equation: , divide by unit volume to get required CPU, and solve for SP.
Break-Even Charts and Graphical CVP Analysis
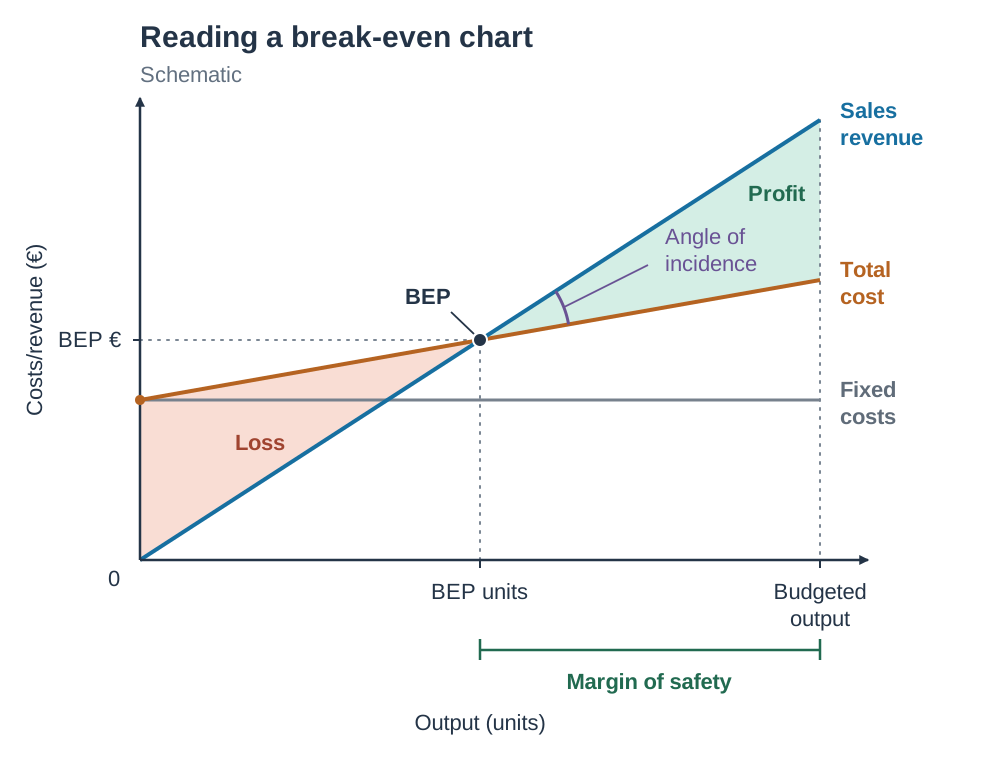
A break-even chart plots costs and revenues against activity levels, illustrating operating risk visually.
How to Construct and Plot a Break-Even Chart
Follow four clear steps:
- Calculate plotting coordinates: Determine total revenue, fixed costs, and total costs at zero units, at break-even units, and at budgeted capacity.
- Draw and label axes: Put sales and output volume in units on the horizontal X-axis. Put values in euro (€) on the vertical Y-axis. Choose an even, uniform scale for both.
- Plot and label the three key lines:
- Fixed Cost line: A horizontal straight line drawn from the fixed cost figure on the Y-axis parallel to the X-axis.
- Total Cost line: Starts at the fixed cost intercept on the Y-axis (never at zero) and rises steadily across the chart.
- Sales Revenue line: Starts at the origin and slopes upwards.
- Identify key intersections and areas:
- Break-Even Point: The intersection of the Total Revenue and Total Cost lines. Draw dotted lines down to the X-axis (BEP in units) and across to the Y-axis (BEP in euro).
- Margin of Safety: The horizontal distance along the X-axis between break-even units and budgeted sales units.
- Angle of Incidence: The angle between the sales line and the total cost line to the right of the break-even point. A wider angle indicates faster profit accumulation.
- Profit and Loss Areas: The wedge between total cost and sales to the left of break-even is the loss area; the opening wedge to the right is the profit area.
- Give the chart an informative title.
Marginal Costing versus Absorption Costing
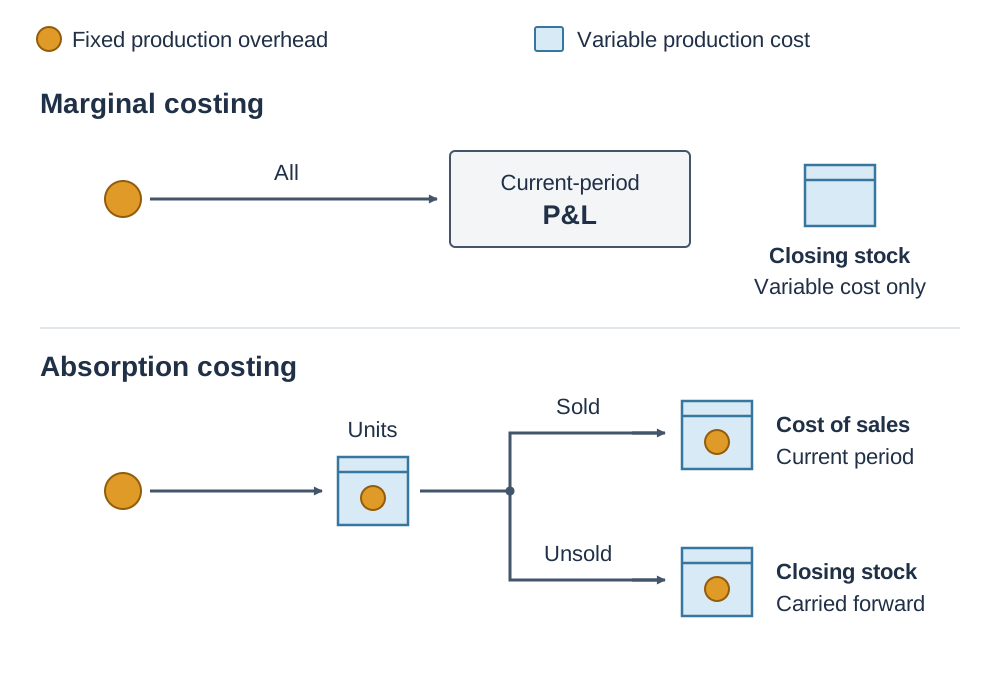
The fundamental difference between marginal costing and absorption costing lies in how they handle fixed factory overheads:
- Marginal costing: Treats fixed production overheads as period costs. They are written off in full against contribution in the Profit and Loss Account during the period incurred. Closing stock (inventory) is valued at variable (marginal) manufacturing cost only.
- Absorption costing: Treats fixed production overheads as product costs. A portion of fixed factory overhead is absorbed into the cost of each finished unit. Closing stock carries forward a share of fixed factory overhead into the next accounting period on the Balance Sheet.
Impact on Reported Net Profit
- When production exceeds sales (closing stock is greater than opening stock), absorption costing reports a higher profit than marginal costing because some fixed factory overheads are carried forward in closing stock to the next period.
- When sales exceed production (closing stock is less than opening stock), marginal costing reports a higher profit because absorption costing releases previously deferred overheads from opening stock into the cost of sales.
- When production equals sales, both methods report identical profit figures.
Model Theory Response: Why Absorption Costing is Used for Financial Accounts
For external published financial statements, absorption costing must be used. Under accounting standards (IAS 2 and FRS 102), closing stock must include all production costs incurred in bringing the stock to its present location and condition, including fixed factory overheads. Marginal costing does not comply with the matching concept for published accounts, because it excludes fixed production overheads from the valuation of closing stock. Marginal costing is strictly an internal tool for short-term planning and decision-making.
Sensitivity Analysis and CVP Limitations
Sensitivity analysis (also known as 'what-if' analysis) evaluates the effect on net profit when key variables change. Management uses it to test scenarios before making decisions, such as changing the selling price, facing material price inflation, increasing advertising budgets, or offering sales staff different commission rates.
Commission as a Percentage of Sales
Pay close attention to how sales commission is structured when testing price changes:
- Commission per unit (such as €1.50 per unit): stays constant if the selling price changes.
- Commission as a percentage of sales (such as 5% of sales): must be recalculated every time the selling price changes.
For example, if base variable costs are €20.00 and commission is 5% of sales:
- At a selling price of €40.00: commission is , making variable cost €22.00 and contribution per unit €18.00.
- At a reduced selling price of €36.00: commission is , making variable cost €21.80 and contribution per unit €14.20.
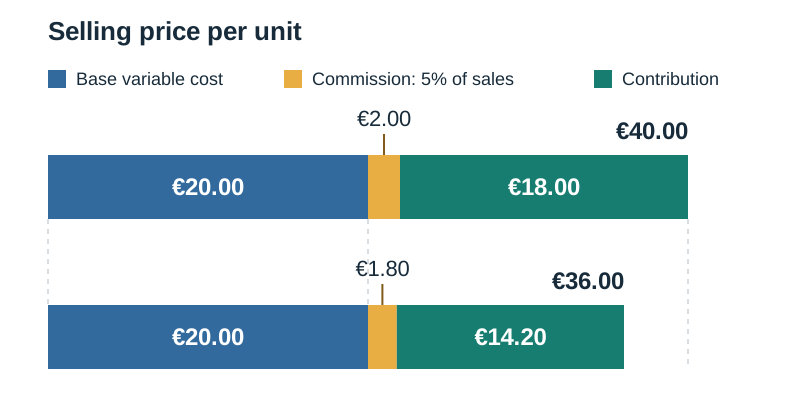
If you leave commission at €2.00 after dropping the selling price to €36.00, your contribution per unit will be wrong by €0.20, distorting every subsequent calculation.
Assumptions and Limitations of CVP Analysis
CVP analysis relies on several simplifying assumptions:
- Constant Selling Price: Assumes selling price per unit does not alter with volume, ignoring bulk discounts or competitive reductions.
- Linear Variable Costs: Assumes variable cost per unit remains constant, ignoring raw material quantity discounts or overtime premiums.
- Static Fixed Costs: Assumes fixed costs do not change across the entire volume range, whereas large output changes cause step-fixed increases.
- Constant Sales Mix: Assumes the business sells a single product or maintains an unchanging mix between multiple products.
- Stock Stability: Assumes production volume equals sales volume, meaning stock levels remain unchanged.
Key terms
- Contribution
- Sales revenue minus all variable costs, representing the funds available to cover fixed overheads and generate net profit.
- Contribution to Sales (C/S) Ratio
- Contribution expressed as a percentage of sales revenue, showing the proportion of each sales euro that contributes towards fixed costs and net profit.
- Break-Even Point (BEP)
- The sales volume (in units or sales value) where total revenue exactly equals total costs, yielding neither a profit nor a loss.
- Margin of Safety (MoS)
- The difference between budgeted or actual sales and break-even sales, indicating how far sales can drop before losses begin.
- Period Costs
- Costs written off in full in the Profit and Loss Account during the accounting period incurred, such as fixed overheads under marginal costing.
- Product Costs
- Costs attached to the units produced and included in closing stock valuation, such as fixed production overheads under absorption costing.
- Absorption Costing
- A costing method that absorbs all manufacturing costs, both variable and fixed, into unit product costs and closing stock valuation.
- Marginal Costing
- A costing approach that charges only variable manufacturing costs to units produced, treating all fixed overheads as period costs.
- Step-Variable Cost
- A cost that remains fixed over very small output increments but rises in frequent, small steps as volume expands.
- Sensitivity Analysis
- A management accounting 'what-if' technique that evaluates how changes in key variables like price, costs, or volume affect projected net profit.
- Controllable Cost
- A cost that can be directly regulated or influenced by a specific departmental manager in the short term, such as material wastage or overtime in the manager's own department.
- High-Low Method
- A mathematical technique that isolates variable cost per unit and fixed costs by comparing the total costs at the highest and lowest activity levels.
Check yourself
What is the difference between contribution and profit?
Contribution is sales revenue minus variable costs (SP − VC), representing funds available to cover fixed costs. Profit is contribution minus fixed costs.
If budgeted sales are 40,000 units and the break-even point is 24,000 units, what is the margin of safety as a percentage of budgeted sales?
Margin of safety in units = 40,000 − 24,000 = 16,000 units. MoS percentage = (16,000 ÷ 40,000) × 100 = 40%.
Using the high-low method, overhead costs are €165,000 at 25,000 units and €115,000 at 15,000 units. What is the variable cost per unit and the total fixed cost?
Variable cost per unit = (€165,000 − €115,000) ÷ (25,000 − 15,000) = €50,000 ÷ 10,000 = €5.00 per unit. Fixed cost = €115,000 − (15,000 × €5.00) = €40,000.
Why does absorption costing show a higher profit than marginal costing when closing stock is greater than opening stock?
Under absorption costing, a portion of fixed factory overhead is absorbed into closing stock and carried forward on the Balance Sheet to the next period, rather than being expensed immediately.