

Interpretation of accounts turns figures from final accounts into meaningful measures of business profitability, liquidity, financial structure, and investment potential. On the Leaving Certificate Higher Level paper, Question 5 is one of the Section 2 options and carries 100 marks (one quarter of the 400-mark examination). Students must work out missing figures by working backwards from ratios, calculate key indicators with exact units, and draft structured evaluative reports advising stakeholders such as prospective bank lenders and ordinary shareholders.
Objectives, Users, and Limitations of Ratio Analysis
The primary objective of ratio analysis is to transform raw balance sheet and profit and loss figures into relative indicators. These allow users to evaluate performance over time, compare the business against industry benchmarks or competitors, and make informed financial decisions.
Stakeholders and Their Interests
- Ordinary shareholders: Interested in profitability and returns. They monitor ROSF, EPS, DPS, dividend yield, dividend cover, P/E ratio, and share price to decide whether to buy, hold, or sell shares.
- Banks and debenture holders: Concerned with financial security and debt service. They examine gearing, interest cover, liquidity, and available fixed assets to decide whether to grant loan finance.
- Trade creditors (suppliers): Focus on the acid test ratio and creditors' credit period to confirm the firm can pay for supplies on time.
- Management: Track all ratios, especially gross margin, expenses, stock turnover, and collection periods, to control day-to-day operations and plan strategy.
- Employees and trade unions: Review profits and liquidity to evaluate job security and back up wage negotiations.
- Revenue Commissioners: Scrutinise reported profits and turnover to ensure correct tax assessment.
Limitations of Ratio Analysis
While essential, ratios have distinct limitations:
- Historical records: Accounts record past performance, which may not continue into the future.
- Balance sheet snapshot: Year-end figures represent a single date and often mask seasonal trading fluctuations.
- Inflation: Fixed assets are recorded at historical cost, distorting comparisons across years or between older and newer businesses.
- Varying accounting policies: Differences in depreciation methods or stock valuation make comparisons between different firms unreliable.
- Industry differences: What counts as a healthy ratio varies by sector. A supermarket operates safely on a very low acid test ratio due to rapid daily cash intake.
- Window dressing: Management may temporarily manipulate year-end balances, such as rushing debt collections or holding off purchases just before year-end.
- Non-monetary factors: Financial accounts omit employee morale, staff skill, customer goodwill, and competitive threats.
- Symptoms rather than causes: Ratios highlight where problems exist, but they do not explain why they occurred without further investigation.
Profitability and Efficiency Ratios
Profitability ratios show how well the business uses its resources to make a profit. Returns must be evaluated against the risk-free rate on government bonds or bank deposits (use any rate given in the exam question, typically 2% to 4%) and the interest rate charged on borrowings.
Return on Capital Employed (ROCE)
- Numerator: Use operating profit (net profit + interest). If taxation appears in the accounts, use profit before interest and tax.
- Denominator: Capital employed equals ordinary share capital plus reserves (profit and loss balance) plus preference shares plus long-term debt (debentures or bank loans). Alternatively, calculate it as total assets less current liabilities.
- Benchmark: Must exceed the risk-free rate and exceed the borrowing rate on debt to ensure positive financial returns.
Return on Ordinary Shareholders' Funds (ROSF)
This isolates the return earned strictly on equity funds after meeting all fixed commitments.
Trading Margins
- Gross Profit Margin:
- Net Profit Margin:
A dropping gross margin suggests higher supplier purchase prices or increased trade discounts. A drop in net margin while gross margin stays steady points to poor overhead cost control.
Rate of Stock Turnover
Expressed in times per year. Stock turnover can also be stated as a period in months: .
A faster rate improves profitability because each inventory turn realizes a profit mark-up, expanding total annual profit. It reduces storage and insurance costs, minimises waste and damage, and secures bulk-buying discounts.
Liquidity, Solvency, and Working Capital Ratios
Examiners regularly test the difference between liquidity and solvency:
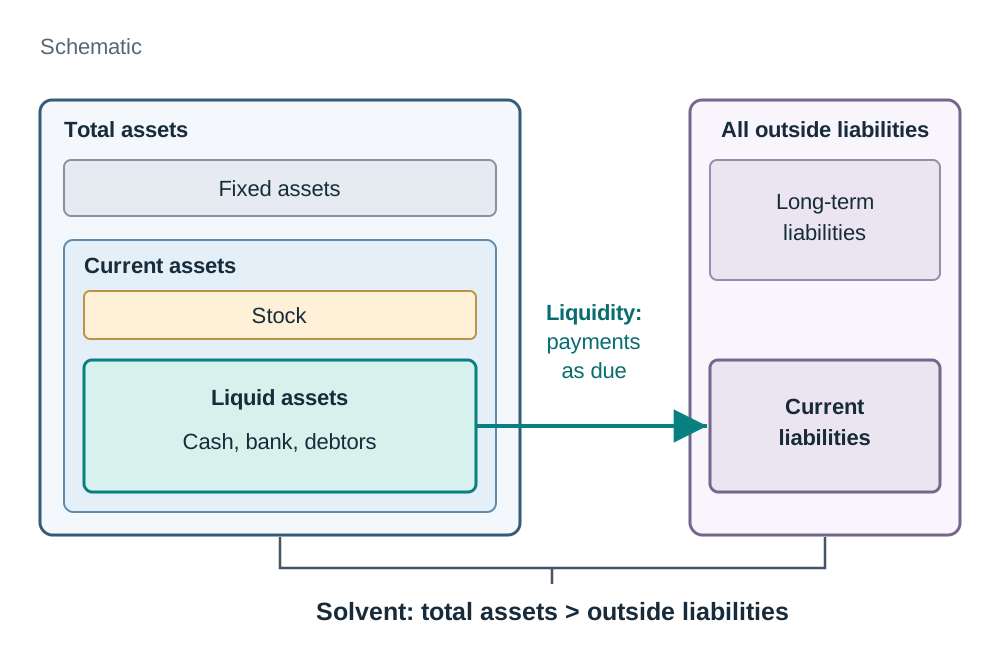
- Liquidity: Measures the ability of the firm to pay its short-term debts as they fall due using liquid assets (cash, bank, and debtors).
- Solvency: Measures whether a business has sufficient total assets to meet all outside liabilities if it were wound up. A business is solvent when total assets exceed total liabilities.
Current Ratio
Ideal about 2:1. A figure well below this suggests possible difficulty meeting short-term debts; confirm this by checking the acid test ratio. A figure well above 2:1 suggests idle resources tied up in unproductive cash or excess stock.
Acid Test (Quick) Ratio
Ideal is 1:1. Closing stock is subtracted because it is the least liquid current asset and cannot be turned into cash immediately.
Debtors' and Creditors' Periods (Working Capital Ratios)
- Debtors' Period:
Normal terms are 1 to 2 months (30 to 60 days). A lengthening collection period hurts cash flow and raises the risk of bad debts.
- Creditors' Period:
Taking excessive credit damages credit ratings, risks loss of cash discounts, and may prompt suppliers to halt deliveries.
Capital Structure, Gearing, and Long-Term Funding
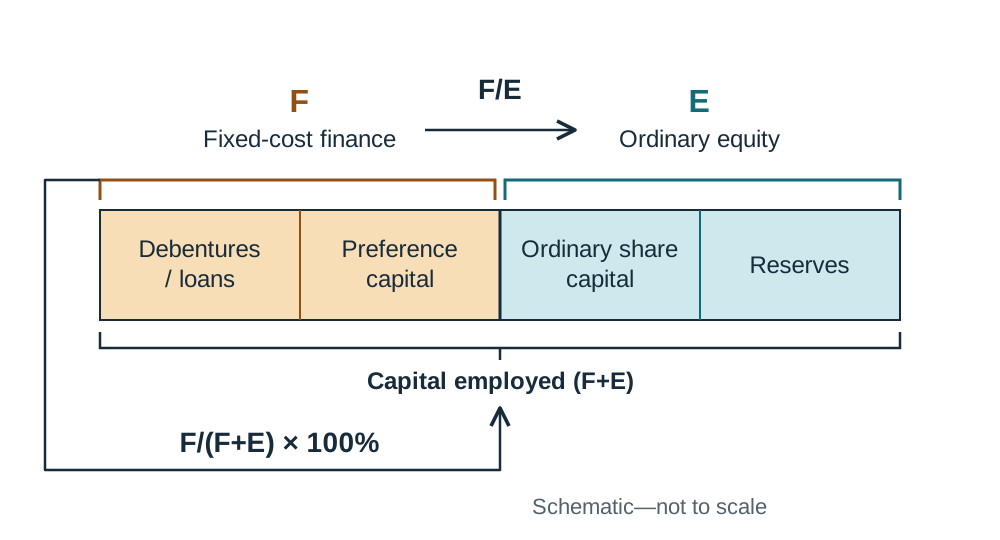
Gearing measures how much of the long-term finance comes from fixed-cost debt compared to ordinary shareholders' equity.
Note: Gearing is also accepted as a debt/equity ratio: . Always state which version you are applying in your workings.
Gearing Levels
- Highly geared (> 50%): Fixed-cost funds exceed equity. While this can magnify returns for ordinary shareholders in successful years, fixed interest must be paid regardless of profit, raising liquidation risk during downturns and making extra borrowing difficult.
- Lowly geared (< 50%): The enterprise is primarily funded by equity, carrying low financial risk.
Reducing Gearing
A company can lower its gearing level by:
- Issuing further ordinary shares.
- Repaying loans or redeeming debentures.
- Retaining more profits in reserves rather than paying dividends.
- Converting debentures into ordinary shares.
Interest Cover
Expressed in times. Cover of 4 times or higher provides safe debt protection. Below 2 to 3 times means the firm is vulnerable if profits decline.
Funding Policy
Long-term assets should be financed by long-term funds (shares, reserves, debentures). Purchasing fixed assets using a bank overdraft causes a serious funding mismatch and damages liquidity.
Investment Ratios and Stakeholder Evaluative Reports
Investment ratios help existing and prospective equity investors assess potential returns, dividend safety, and share valuations.
- Earnings Per Share (EPS): (quoted in cents)
- Dividend Per Share (DPS): (quoted in cents)
- Dividend Cover: (quoted in times)
- Dividend Yield: (quoted in %)
- Price Earnings (P/E) Ratio: (quoted in years)
Measures the payback period in years. A rising P/E reflects market confidence in growth, but represents a longer recovery period at current earnings.
Report Layout (Higher Level)
When asked to prepare a formal report, adopt standard business presentation:
- To: (e.g., The Board of Directors / Bank Manager / Ordinary Shareholders)
- From: (e.g., Financial Consultant / Accountant)
- Date:
- Subject: (e.g., Performance Review and Loan Assessment for Corrib plc)
- Body: Numbered sections examining each key dimension.
- Conclusion / Recommendation: Clear, direct decision.
- Signed:
Evaluative Writing Checklist
For every ratio comment in the body of your answer, apply this exact sequence:
- Name the ratio.
- Quote the figures for both years with exact units (%, :1, times, years, cents).
- State whether the trend represents an improvement or disimprovement.
- Compare the figure to an established benchmark or borrowing rate.
- Explain the practical business implications for the specific stakeholder.
Key terms
- Return on Capital Employed (ROCE)
- Operating profit before interest and tax expressed as a percentage of total long-term capital employed.
- Return on Ordinary Shareholders' Funds (ROSF)
- Profit available to ordinary shareholders (net profit less preference dividend) expressed as a percentage of equity funds (ordinary share capital plus reserves).
- Acid Test Ratio
- A strict test of liquidity that compares liquid assets (current assets less closing stock) with current liabilities; ideal benchmark is 1:1.
- Solvency
- The state where a company's total assets exceed its total external liabilities, indicating long-term financial survival upon liquidation.
- Gearing
- The proportion of total capital employed funded by fixed-cost finance (debentures, term loans, and preference share capital).
- Interest Cover
- Operating profit before interest divided by total annual interest charged, measuring how many times earnings cover annual debt interest costs.
- Price Earnings (P/E) Ratio
- Market price per share divided by earnings per share, indicating the number of years needed to recoup the market price at current earnings.
- Dividend Cover
- Net profit after preference dividends divided by total ordinary dividend paid, showing how many times ordinary dividends are covered by current earnings.
- Stock Turnover
- Cost of sales divided by average stock, reflecting how many times inventory is sold and replaced during an accounting period.
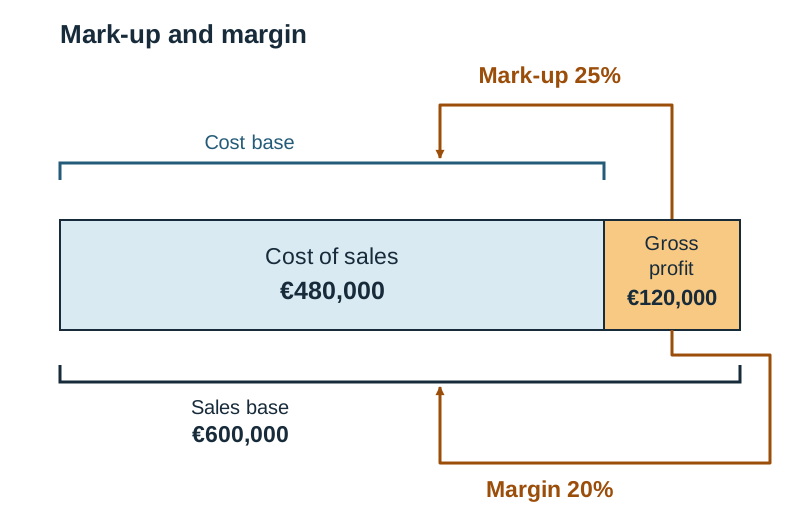
- Mark-up
- Gross profit expressed as a percentage of cost of sales.
- Margin
- Gross profit expressed as a percentage of sales revenue.
Check yourself
If trade debtors are €84,000 and the credit period allowed to debtors is 2 months, what are total credit sales?
Credit sales = (€84,000 × 12) / 2 = €504,000.
A business has current assets of €150,000, closing stock of €60,000, and current liabilities of €75,000. Calculate the acid test ratio.
Acid test ratio = (€150,000 - €60,000) / €75,000 = €90,000 / €75,000 = 1.20:1.
A firm has an acid test ratio of 1.2:1, current liabilities of €75,000, and total current assets of €150,000. What is the value of closing stock?
Liquid assets = 1.2 × €75,000 = €90,000. Closing stock = Current assets (€150,000) - Liquid assets (€90,000) = €60,000.
Distinguish between liquidity and solvency.
Liquidity is the ability to pay short-term debts as they fall due using liquid assets. Solvency is the ability of a business to meet all liabilities from total assets if it ceases trading.
A company reports net profit of €95,000, debenture interest of €15,000, and capital employed of €880,000. What is its ROCE?
Operating profit = €95,000 + €15,000 = €110,000. ROCE = (€110,000 / €880,000) × 100 = 12.50%.
List four practical methods an enterprise can use to reduce its gearing level.
1. Issue further ordinary shares. 2. Repay outstanding loans or debentures. 3. Retain more profits in reserves. 4. Convert debentures into ordinary shares.
How does a faster rate of stock turnover improve profitability?
Every time stock turns over it earns a profit mark-up, so more turns generate greater annual gross profit. It also cuts storage and insurance costs, minimises waste and damage, and secures bulk-buying discounts.
If an ordinary share has a market price of €2.10 and earnings per share of 28c, what is the P/E ratio?
P/E ratio = 210c / 28c = 7.50 years.