

Flexible Budgeting, Cost Behaviour, and Variances (HL)
A static budget plans for a single activity level. If actual output differs, comparing actual costs directly against a static budget is misleading because higher production inevitably causes total variable costs to rise.
A flexible budget restates budgeted costs to match the actual level of activity achieved, allowing a fair, like-for-like performance comparison.
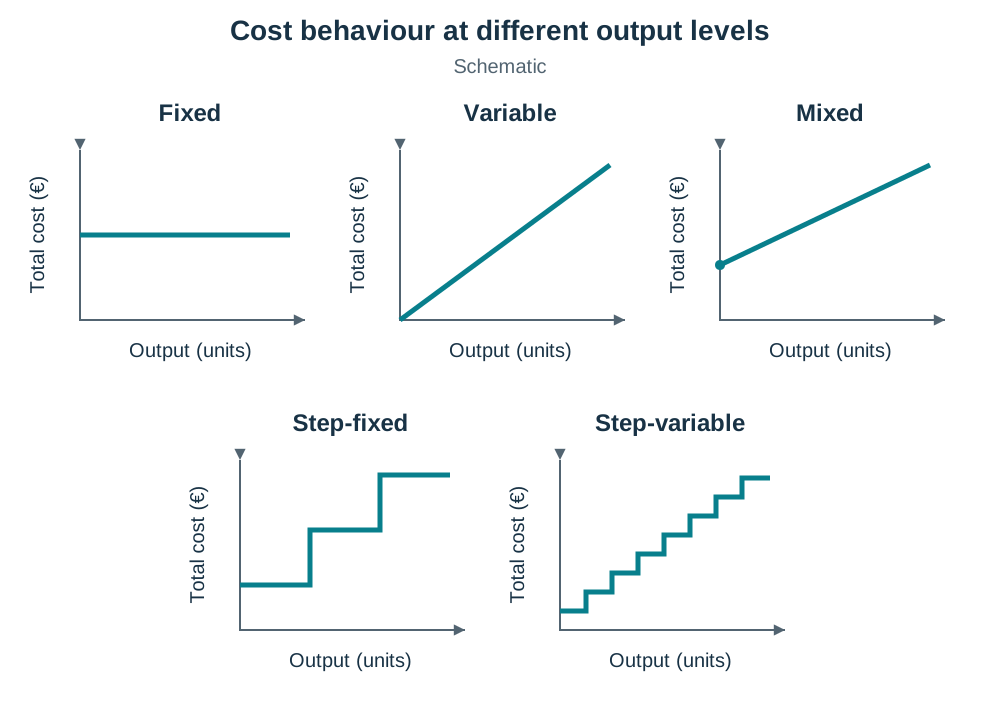
Cost Behaviour Patterns
- Fixed Costs: Remain unchanged in total within a relevant range of activity (for example, factory rent).
- Variable Costs: Change in total in direct proportion to output, but stay the same per unit (for example, direct materials at €5 per unit).
- Semi-Variable (Mixed) Costs: Contain both a fixed base charge and a variable rate per unit (for example, electricity or maintenance).
- Step-Fixed Costs: Remain constant over a specific activity range, then jump by a lump sum once an activity threshold is crossed (for example, hiring a second supervisor when output exceeds 10,000 units).
- Step-Variable Costs: Rise in frequent small steps as output increases, behaving almost like a variable cost over a wide range (for example, casual packing staff hired for each extra batch of 500 units, or packaging bought in boxes of 100).
The High-Low Method for Mixed Costs
To isolate the fixed and variable elements of a semi-variable cost from two activity levels:
Flexible Budget Presentation
Flexible budgets are normally set out in marginal costing format, and the question will usually ask for this:
| Item | Amount (€) |
|---|---|
| Sales Revenue | X |
| Less: Total Variable Costs | (X) |
| Contribution | X |
| Less: Total Fixed Costs | (X) |
| Budgeted Net Profit | X |
Contribution (Sales Revenue minus Variable Costs) represents the surplus generated to cover fixed costs. Once fixed costs are fully recovered, every additional euro of contribution adds directly to net profit.
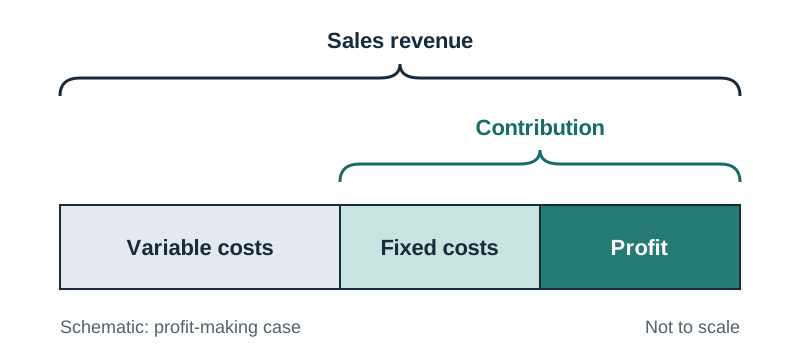
Comparing Actual Results with the Flexible Budget
To evaluate performance, flex the budget to the output actually achieved and compare it line by line with actual results:
| Cost Item | Flexed Budget (€) | Actual (€) | Variance (€) |
|---|---|---|---|
| Direct materials | 80,000 | 84,500 | 4,500 A |
| Direct labour | 160,000 | 154,000 | 6,000 F |
| Fixed overheads | 92,000 | 92,000 | nil |
A favourable variance (F) occurs when actual costs are lower than budget or revenue is higher. An adverse variance (A) occurs when actual costs exceed budget or revenue falls short. A variance on direct materials can come from price (the material cost more or less per kg than planned, for example because of a bulk discount) or from usage (more or fewer kg were used than planned). A variance on direct labour can come from the wage rate or from efficiency (fewer hours were needed than budgeted, for example because staff worked more productively). In the table above, the €6,000 F on labour could arise because fewer hours were needed than budgeted. Comparing actual costs against a static budget instead of the flexed budget can make an overspend look like a saving.
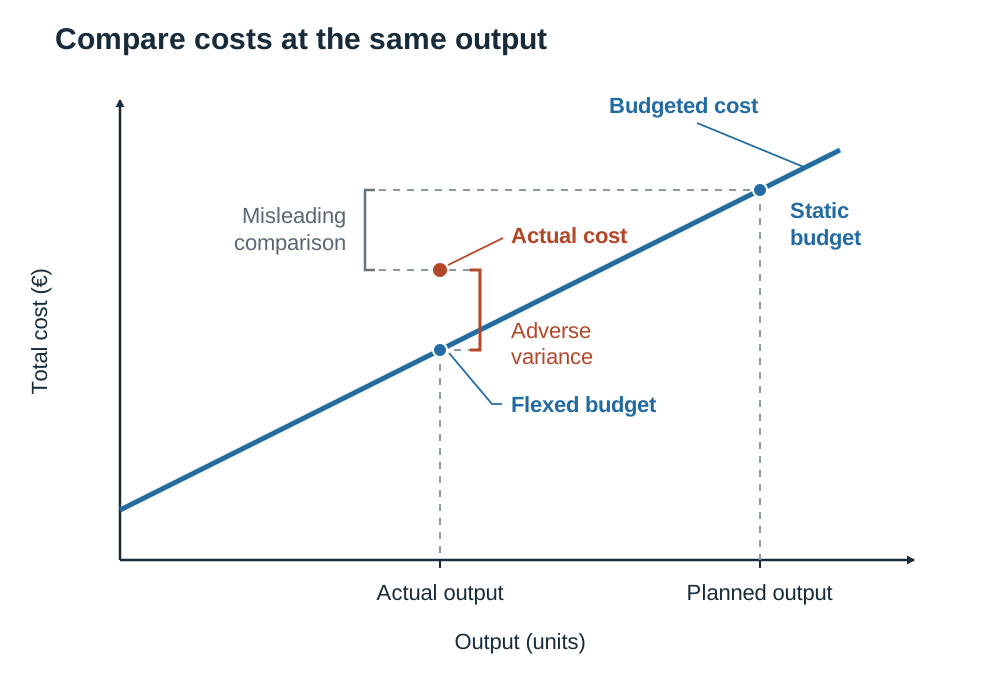
Controllable versus Uncontrollable Costs
- Controllable Costs: Costs that a specific departmental manager has the direct authority to influence and regulate (such as raw material scrap rates or direct labour overtime). Managers can be held accountable for variances in these costs.
- Uncontrollable Costs: Costs that a departmental manager cannot influence because they are set externally or by central management (such as local authority commercial rates). A manager cannot be held responsible for variances on uncontrollable costs.
Sensitivity Analysis
Sensitivity analysis is a 'what-if' technique that measures how budgeted profit changes if key variables alter. For example, in the Boyne Ltd flexible budget below (sales €575,000, profit €115,000), if the selling price falls by 5% while volume and costs stay the same, sales revenue falls by 5% × €575,000 = €28,750, so budgeted profit falls from €115,000 to €86,250.