

Every biology experiment has to answer two fundamental questions: does it actually test what it claims to test, and can the numbers be trusted? Investigating in Science is part of the unifying strand, Nature of Science, which underpins all three contextual strands in Leaving Certificate Biology: Organisation of Life, Structures and Processes of Life, and Interactions of Life. This topic brings together the tools of scientific inquiry: how to frame a testable hypothesis, design a fair test with rigorous controls, distinguish random from systematic errors, evaluate secondary sources, and build an evidence-based argument. These skills are assessed in the terminal written examination (60% of certification marks) and through your coursework report, the Biology in Practice Investigation (40% of certification marks).
The Investigative Process and Coursework Rules
Authentic scientific inquiry rarely follows a neat, rigid line. Biologists move back and forth between stages: preliminary trials reveal design flaws, unexpected data makes you rethink the hypothesis, and a shortage of equipment often forces you to change the method. In Leaving Certificate Biology, this iterative process forms the spine of the Biology in Practice Investigation.
How the Investigation is Organised
In Term 2 of Year 1, the State Examinations Commission (SEC) releases an annual brief outlining a broad biological context. You explore this context, carry out secondary research, and design and execute your own laboratory or field experiment. In Year 2, you submit a finalised digital report to the SEC for examination. The entire investigation takes approximately 20 hours in total. The stages are spread throughout the two years rather than done in one block, and you may begin work in class and continue it outside class, as with any other coursework.
| Stage | Operational Focus | Indicative Timing |
|---|---|---|
| Stage 1: Initial Response to the Brief | Explore the phenomenon in the SEC brief, make links to the specification, and brainstorm initial lines of inquiry. | 1–2 hours |
| Stage 2: Background Research | Gather and evaluate secondary sources, consider wider scientific and societal relevance, and frame a research question. | 2–3 hours |
| Stage 3: Designing and Planning | Formulate a testable hypothesis grounded in theory, select apparatus, establish controls, and address safety and feasibility. | 2–3 hours |
| Stage 4: Conducting the Experiment | Carry out the planned procedure under teacher supervision, recording raw observations and data. | 1–2 hours per laboratory session |
| Stage 5: Data Analysis and Conclusions | Calculate rates, plot graphs, isolate anomalies, evaluate sources of error, and assess whether the hypothesis is supported. | 1–2 hours |
| Stage 6: Finalising the Report | Bring your research and experimental findings together into one consistent account, state limitations honestly, and explain iterations and changes. | Up to 4 hours |
The Investigative Log
Throughout the process, you maintain an investigative log. This is your personal working notebook—digital or hard copy—where you record raw data, calculation workings, source evaluations, download dates, photographs of apparatus, and reflections. The log is not submitted to the SEC for marking, but sharing it regularly with your teacher is essential for authentication.
Teacher Role, Peer Assistance, and Authentication
Your teacher acts as a supervisor and sounding board. They can clarify the brief, direct you towards relevant syllabus outcomes, provide prompt questions, and guide your research and referencing skills. However, official regulations strictly define what a teacher cannot do:
- Your teacher may not design your experiment for you—you must have complete ownership of your experimental design.
- Your teacher will not intervene while you work, even if you make experimental errors, use equipment incorrectly (provided it is safe), or record data poorly.
- Your teacher will not correct drafts of your report for you to rewrite.
- Your teacher must be present at all times during experiments and will only intervene if a procedure is unsafe.
Each student must complete an individual investigation. During experimental work, another student may help you physically manipulate apparatus, but designing, analysing, and writing up the report must be done by you alone. Submitting work that is not entirely your own constitutes a serious breach of examination regulations and can lead to severe penalties, including the withholding of results.
If Your Results Are Unexpected
Credit in science is awarded for the quality of your thinking and investigative rigor, not for producing a tidy textbook answer. If your primary data fails to support your hypothesis, you have not failed. State plainly that the hypothesis is refuted, identify the experimental limitations that caused the discrepancy (such as narrow variable ranges or unmonitored confounding factors), and explain the exact refinements you would introduce next time. Never falsify, discard, or massage data to match your prediction; doing so breaches scientific integrity.
Four Questions to Check Your Report
Before finalising your submission, check your work against the four quality descriptors:
- Have I engaged thoroughly with the biological concepts, explained them accurately, and posed a testable hypothesis underpinned by theory?
- Are my experimental design and methods clear and appropriate, producing high-quality primary data?
- Are my conclusions valid and justified by the data, and have I thoroughly evaluated the investigation by acknowledging sources of error?
- Have I offered a considered reflection that connects my findings to the work of scientists and to wider societal issues?
The Research Strand: Sources, Questions, and Evidence-Based Arguments
A complete investigation requires two parallel strands of evidence: primary data you collect yourself, and secondary information gathered by others.
- Primary data: Information collected directly by the investigator during their own laboratory experiment or fieldwork.
- Secondary data: Information gathered by somebody else, obtained through scientific journals, books, reputable online databases, or official agency reports.
Research Question versus Hypothesis
Do not muddle these two terms; they perform distinct functions in your report:
- A research question addresses the wider issue you explore using secondary sources. It investigates broader biological mechanisms, consequences, or conflicting viewpoints (e.g. How does rising soil salinity affect Irish roadside plant communities, and what sustainable alternatives to rock salt exist?).
- A hypothesis is the narrow, testable prediction that your own practical experiment directly investigates, with a clearly defined independent and dependent variable (e.g. Increasing sodium chloride concentration from 0.0 M to 0.5 M will decrease the percentage germination of cress seeds over five days.).
Your final report must explicitly link its conclusions back to both your research question and your hypothesis.
Evaluating Secondary Sources
Secondary sources vary widely in quality and reliability. For every source you consult, evaluate its credibility in your investigative log by checking:
- Authorship and Bias: Who produced the source? What are their qualifications? Do they hold a commercial or financial interest in promoting a specific outcome? Bias is any systematic influence that pushes sampling, measurement, or interpretation toward a particular conclusion.
- Origin of Data: Is the document reporting original, peer-reviewed scientific research, or is it a simplified media summary that strips away nuances and caveats?
- Scientific Detail: Does the source provide complete experimental details, including sample sizes, control setups, measurement units, and dates?
- Consensus and Verification: Are the conclusions supported by independent studies, or does this source stand alone?
Quoting only articles that agree with your preferred conclusion introduces cherry-picking bias. High-quality scientific research reviews and evaluates contrasting viewpoints before arriving at a justified position.
Building an Evidence-Based Argument
The goal of your background research and experimental work is to construct an evidence-based argument in response to the SEC brief. This requires combining your primary experimental data with evaluated secondary literature while frankly acknowledging the boundaries of both:
- State your claim clearly in response to the research question.
- Support that claim with specific numerical data from your own experiment.
- Show how your primary findings align with published secondary research.
- Acknowledge procedural limitations and specify the precise conditions under which your conclusion remains valid.
Hypothesis Formulation and Comparing Experimental Strategies
Scientific inquiry starts with an empirical observation of the living world. To be scientifically investigable, a question must focus on physical biological structures and mechanisms that can be tested through direct measurement or sampling. Subjective preferences, moral assertions, and ethical dilemmas cannot be settled by empirical measurement alone, though biological data can help inform ethical decisions.
From an investigable question, you construct a hypothesis: a proposed, testable explanation for an observed biological phenomenon, rooted in scientific theory.
- Weak formulation: Yeast produces gas faster when it is warmer.
- Testable Higher Level formulation: Increasing the incubation temperature of a Saccharomyces cerevisiae suspension from 10 °C to 40 °C will increase the rate of carbon dioxide production during anaerobic respiration, because increased kinetic energy raises the frequency of effective collisions between glucose substrates and respiratory enzymes.
A rigorous hypothesis specifies the independent variable, the dependent variable, the expected direction of change, and the underlying biochemical mechanism.
Evaluating Competing Investigative Strategies
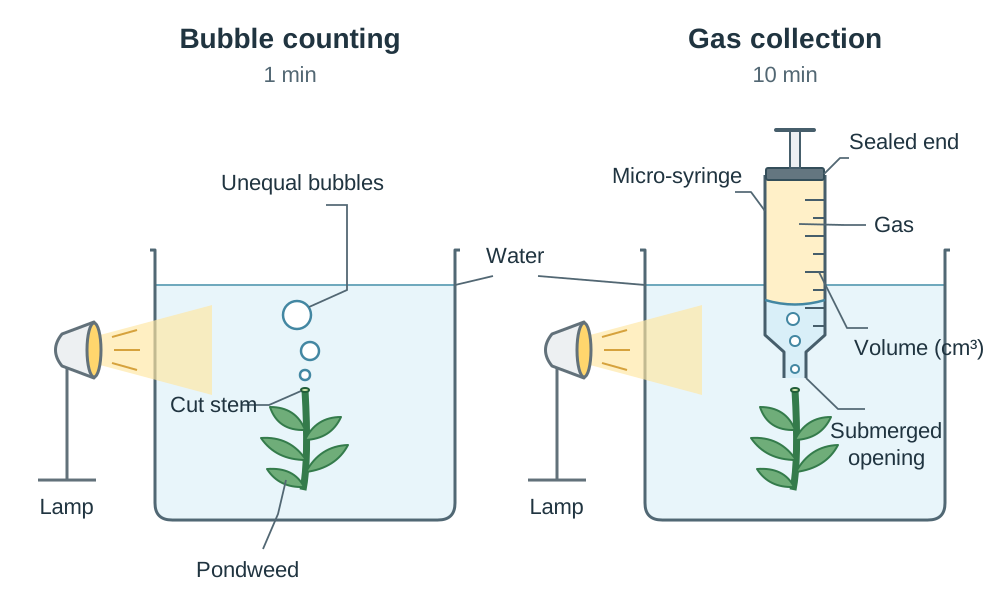
Learning Outcome U2.2 requires you to compare different methods for testing the same hypothesis. For instance, if you are investigating the effect of light intensity on pondweed (Elodea) photosynthesis, two main strategies exist:
- Bubble Counting: Counting the bubbles of oxygen gas released per minute from a freshly cut stem. This method is quick, requires minimal apparatus, and allows you to test many lamp distances within a single class period. However, bubble size varies, and rapid bubbling makes counting unreliable, introducing severe random error.
- Micro-Syringe Gas Collection: Collecting gas volume using an inverted, water-filled micro-syringe or capillary tube over 10 minutes. This method requires specialised, gas-tight glassware and takes longer per run, restricting the number of light intensities you can test. However, it directly measures actual gas volume in cm³, providing far superior accuracy and precision.
Whenever you compare two investigative strategies in an exam or report, evaluate them across four criteria: directness of measurement, size of potential errors, apparatus complexity and time demands, and ability to cover the full range of the independent variable. Conclude with a clear recommendation and justification.
Experimental Design: Variables, Controls, and Equipment Selection
A fair test isolates the biological mechanism being examined by ensuring that only one factor influences the measured outcome. Biologists manage three distinct variable classes:
- Independent variable: The specific factor you deliberately alter across treatments (e.g. sodium chloride concentration: 0.0 M, 0.1 M, 0.2 M, 0.3 M, 0.4 M, 0.5 M).
- Dependent variable: The response you measure to gauge the effect of the independent variable (e.g. percentage of seeds that germinate).
- Controlled variable: Any external factor capable of altering the dependent variable that must be kept strictly constant across all experimental setups (e.g. temperature, solution volume, seed batch, light exposure).
Control Experiment versus Controlled Variables
These two terms are easily confused, and confusing them costs marks because they perform different roles in experimental design:
- Controlled variables are physical, chemical, or biological factors held constant across all setups so the test remains fair (for example, keeping all tubes in a 25 °C water bath).
- A control experiment is a complete, separate comparative setup run alongside your experimental series. It contains identical apparatus, volumes, and controlled variables, but completely lacks the active independent variable. Its purpose is to demonstrate that the observed outcome was caused solely by the independent variable and did not occur spontaneously. In an enzyme trial, the control setup uses boiled, denatured enzyme or distilled water in place of active enzyme.
Equipment Selection and Resolution
An instrument's resolution is the smallest change in the measured quantity that its scale can detect. Measuring 1.5 cm³ of buffer in a 50 cm³ graduated cylinder introduces an unacceptably large uncertainty, because 1.5 cm³ is a tiny fraction of the cylinder's range and each scale division is far too coarse to read it accurately. Using a 2.0 cm³ graduated pipette provides the necessary scale resolution. While high resolution enhances precision, it does not guarantee accuracy if the instrument is incorrectly calibrated or zeroed.
Before undertaking a complete investigation, scientists often conduct a pilot investigation. This small preliminary trial checks whether the chosen reagent concentrations yield measurable results within the allotted time, confirms that apparatus resolution is sufficient, and verifies safety precautions, allowing you to refine your method before formal data collection.
Measurement Quality: Accuracy, Precision, Repeatability, and Reproducibility
Evaluating experimental evidence requires precise scientific vocabulary:
| Quality Criterion | Meaning | How to Demonstrate or Achieve |
|---|---|---|
| Accuracy | How close a measured value is to the true or accepted biological value. | Calibrate instruments against known standards, eliminate zero offsets, and maintain tight control of confounding variables. |
| Precision | How close repeated measurements of the same quantity are to one another. | Use measuring instruments with higher resolution and maintain consistent measurement technique. |
| Repeatability | Closeness of agreement among successive results obtained by the same investigator using the same apparatus and protocol in the same laboratory. | Carry out replicate trials under identical conditions during the same laboratory session. |
| Reproducibility | Closeness of agreement among results obtained by different investigators using different equipment or working in different laboratories. | Write unambiguous, step-by-step protocols and compare results with independent published studies or peer groups. |
| Validity | The extent to which an experiment actually measures what it claims to measure. | Ensure a fair test where only the independent variable changes, supported by an appropriate negative control. |
| Reliability | The extent to which an investigation yields consistent results when repeated. | Conduct replicate trials, maintain an adequate sample size, use consistent technique, and calculate mean values. |
The Target Analogy
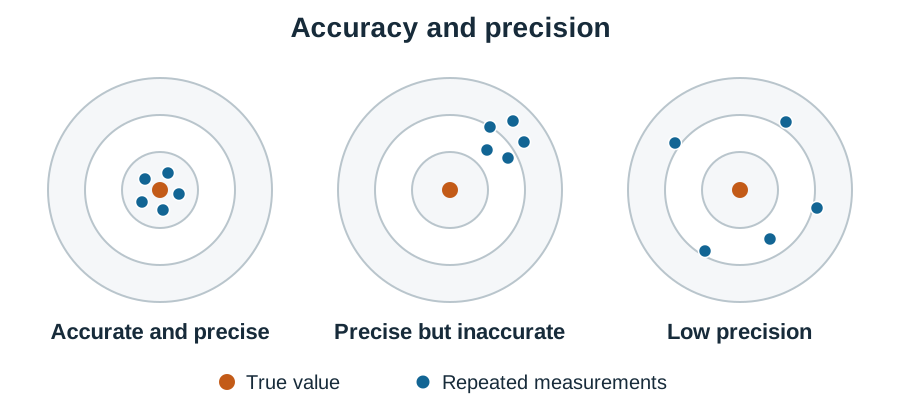
Picture a target. How close your shots land to the bullseye represents accuracy. How tightly clustered your shots are, regardless of where they strike the target, represents precision. A tight cluster positioned well away from the bullseye is precise but inaccurate: if an uncalibrated digital balance always reads 0.50 g too high, repeated measurements of the same leaf will be tightly clustered (precise) but every one of them will be 0.50 g too high (inaccurate).
Sources of Experimental Error: Random versus Systematic
Every measurement carries some uncertainty. You must be able to classify the two primary types of experimental errors and identify their correct remedies:
| Feature | Random Error | Systematic Error |
|---|---|---|
| Nature & Cause | Unpredictable, chance fluctuations in ambient conditions, slight stopwatch reaction delays, or parallax differences when reading a meniscus. | Predictable, consistent bias built into equipment calibration or experimental design (e.g. an unzeroed balance or a water bath thermometer reading 2 °C high). |
| Effect on Data | Causes measured values to scatter unpredictably above and below the true value, reducing precision. | Displaces all measurements in the same direction by a consistent margin, reducing accuracy. |
| Corrective Action | Carry out multiple replicate trials (at least 3 to 5 runs) and calculate a mean; increase biological sample size. Random variations cancel out. | Recalibrate instruments, reset/tare balances to zero before use, and correct experimental design flaws. Averaging repeated trials does not remove a systematic error—every reading is shifted the same way, so the mean is shifted too. |
Inherent biological variation among living specimens is a natural property of life, not an investigator error. Manage it through large sample batches and random allocation.
Data Handling: From Time to Rate, Graphs, and Anomalies
Biological data falls into two broad categories:
- Qualitative data: Descriptive, non-numerical observations (such as an iodine solution turning blue-black).
- Quantitative data: Numerical measurements with units (such as gas volume in cm³ or time in seconds).
Converting Reaction Time to Rate
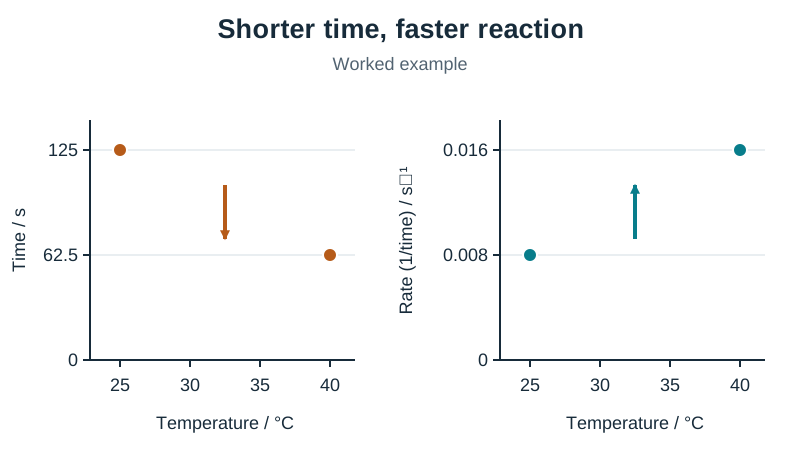
In many enzyme and physiological experiments, you measure the time taken for a reaction to complete. A shorter time indicates a faster reaction rate, meaning the raw time is inversely proportional to rate:
Always convert time into rate before plotting your graph. For example, if starch digestion takes 62.5 s at 40 °C, the rate is . If digestion takes 125 s at 25 °C, the rate is . A graph of raw time is the inverse of a graph of rate: here the time line falls from 125 s to 62.5 s as temperature rises, even though the reaction is speeding up, so a time graph can easily be misread. Converting to rate (0.008 s⁻¹ at 25 °C, 0.016 s⁻¹ at 40 °C) gives a line that rises with the reaction rate.
Graphing Conventions That Gain Marks
- Place the independent variable on the horizontal () axis and the dependent variable on the vertical () axis.
- Label both axes clearly with the quantity and its unit (e.g. NaCl concentration / M, Germination / %).
- Choose linear scales that allow your plotted points to occupy more than half of the grid space on both axes.
- Plot coordinates accurately and draw a smooth line or curve of best fit. Do not join points dot-to-dot unless the data consists of discontinuous categories.
- When describing trends in written answers, always quote numerical values with units (e.g. Germination fell from 92% at 0.0 M to 18% at 0.4 M, with the sharpest decrease occurring between 0.2 M and 0.3 M).
Managing Anomalous Results
An anomalous result is an outlier that deviates distinctly from the pattern established by replicate trials. Never delete or ignore an anomaly. Check for immediate procedural flaws (such as an unsealed stopper or a delayed stopwatch) and repeat the trial if feasible. When processing results, you may exclude a verified anomaly from the calculated mean, but you must circle it on graphs, record its value in your log, and provide an explicit written justification for its exclusion.
Correlation versus Causation
A correlation indicates that two variables change together. Causation means that a change in one variable directly produces the change in the other. Two variables may correlate by pure chance or because both respond to an unmeasured third factor. Only a controlled experiment that isolates the independent variable can demonstrate causation.
Locating Your Investigation in Science and Society
A high-quality investigation does not stop at experimental conclusions. You must also show why your findings matter and how they relate to the work of professional scientists and wider society. In the SEC quality descriptors, demonstrating this reflection across the specification cross-cutting themes (Health, Sustainability, and Technology) earns marks:
- Real-world application: Identify the broader context to which your topic belongs (such as agricultural food production, water quality monitoring, antibiotic stewardship, or habitat conservation).
- The work of a scientist: Explain what professional researchers in this field do. Compare your laboratory investigation with professional scientific practice, highlighting differences in scale, instrumentation, field sampling across seasons, statistical modeling, and international peer review.
- Science and society: Identify the economic, social, sustainability, or ethical factors that dictate how scientific findings are translated into public policy.
Model Societal Context: Soil Salinity and De-Icing Salts
In my investigation, cress seed germination dropped sharply at sodium chloride concentrations above 0.2 M. Soil and plant scientists investigate these same osmotic relationships on a far larger scale, conducting multi-year field trials across diverse soil textures, utilizing electronic conductivity meters rather than simple prepared solutions, and publishing their datasets for independent replication. This work has direct implications for environmental sustainability. Local road authorities face a delicate balance: while applying rock salt in winter is essential for motorist safety (a social and economic necessity), seasonal runoff raises roadside soil salinity, stunting native flora and damaging earthworm populations. My small-scale laboratory experiment cannot on its own dictate municipal de-icing practices, but it provides clear empirical evidence of the osmotic threshold above which seed germination is severely impaired.
Key terms
- Hypothesis
- A testable proposed explanation for an observed biological phenomenon, developed using scientific theories and explanations.
- Independent Variable
- The factor deliberately altered or manipulated across treatments by the investigator during an experiment.
- Dependent Variable
- The factor measured or observed to determine the effect of changing the independent variable.
- Controlled Variable
- Any factor other than the independent variable that could alter the dependent variable and must be kept strictly constant across all trials.
- Control Experiment
- A complete comparative setup run alongside an experiment under identical conditions, but lacking the independent variable, to prove it alone caused the result.
- Primary Data
- Data collected directly by the investigator themselves during their own practical experiment or fieldwork.
- Secondary Data
- Data collected by somebody else, which the investigator obtains from published scientific literature, reports, or databases.
- Accuracy
- The degree of closeness between a measured or calculated value and the true or accepted biological value.
- Precision
- The closeness of agreement among repeated measurements of the same quantity under identical conditions.
- Reliability
- The extent to which an investigation gives consistent results when the procedure is repeated under the same conditions.
- Repeatability
- The closeness of agreement among successive results obtained by the same investigator using the same apparatus and protocol in the same laboratory.
- Reproducibility
- The closeness of agreement among results obtained by different investigators using different equipment or working in different laboratories.
- Validity
- The extent to which an experiment successfully tests the specific hypothesis it was designed to test, free from confounding variables.
- Random Error
- An unpredictable measurement variation caused by chance fluctuations that causes readings to scatter above and below the true value.
- Systematic Error
- A predictable, consistent measurement deviation caused by miscalibrated equipment or flawed design that shifts all readings in the same direction.
- Anomalous Result
- A recorded measurement that deviates distinctly from the established trend or expected pattern of other replicate readings.
- Resolution
- The smallest change in a measured quantity that can be detected and displayed on the scale of a measuring instrument.
- Bias
- Any systematic influence that slants sampling, experimental measurement, or data interpretation toward a particular outcome.
- Pilot Investigation
- A small-scale preliminary trial carried out to assess procedural feasibility, test equipment ranges, and refine experimental design.
- Correlation
- A mutual statistical association between two variables, which does not by itself prove that one variable causes the change in the other.
- Causation
- A proven cause-and-effect relationship where altering one variable directly produces the observed change in another.
- Scientific Integrity
- The honest and transparent adherence to ethical standards in planning, executing, recording, and reporting scientific research.
- Investigative Log
- The personal working document where a student records raw data, reflections, source evaluations, and iterations throughout their investigation.
- Evidence-Based Argument
- A justified conclusion or position built by combining primary experimental data with evaluated secondary evidence, noting limitations.
Check yourself
What is the key difference between a research question and a scientific hypothesis in an investigation?
A research question explores a broad scientific issue or societal debate using secondary sources, whereas a hypothesis is a narrow, testable prediction with an independent and dependent variable tested directly by your own primary experiment.
An electronic top-pan balance displays 0.45 g when empty. If an investigator uses it without taring, what error occurs and how does it affect the results?
A systematic error (zero-offset error). It shifts all recorded masses in the same direction, making every measurement consistently 0.45 g heavier than the true mass.
Explain the difference between repeatability and reproducibility in biological investigations.
Repeatability is the agreement between successive results obtained by the same investigator using the same apparatus in the same laboratory. Reproducibility is the agreement obtained when different investigators replicate the work using different apparatus or in different laboratories.
A student's primary experimental data fails to support their hypothesis. State two things they should do and one thing they must never do.
They should state clearly that the evidence does not support the hypothesis and explain the likely experimental limitations that caused it; they should also suggest specific procedural refinements. They must never falsify, discard, or invent data to match their prediction.
Why must reaction time data be converted to rate (1 ÷ time) before plotting an enzyme or respiration graph?
Because time is inversely proportional to reaction rate. A shorter reaction time represents a faster rate, so plotting time directly would produce a curve that appears to go up when the reaction is slowing down.
What role does a teacher play while a student conducts their Biology in Practice Investigation experiment?
The teacher supervises the laboratory or field setting to ensure safety and authenticate student work, but does not intervene to correct experimental errors, faulty recording, or incorrect (but safe) apparatus manipulation.
What is the assessment weighting between the terminal written examination and the Biology in Practice Investigation coursework?
The terminal written examination is weighted at 60% and the Biology in Practice Investigation coursework is weighted at 40%.