

Studying a Habitat (Ecological Investigation)
Field investigations generate primary data to model habitats, evaluate species distribution, and explore ecological relationships.
1. Habitat Modelling and Mapping
Produce a sketch map of the chosen habitat (such as a hedgerow, grassland, or rocky shore). Record its physical dimensions, dominant plant and animal species, prevailing abiotic factors, a north indicator arrow, and a clear key.
2. Collection Methods for Fauna
Choose collection apparatus suited to the organism's ecology:
- Pooter: A small jar with two tubes used to suck up small insects and spiders without harming them.
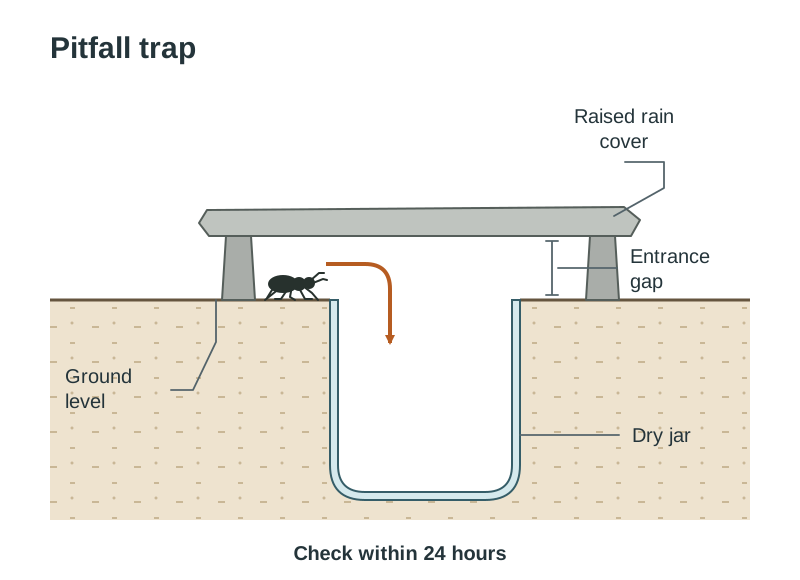
- Pitfall trap: A jar sunk level with the ground surface, protected by a raised flat stone to exclude rain. It catches ground-dwelling invertebrates like ground beetles. It must be checked within 24 hours to prevent trapped animals preying on one another.
- Sweep net: Swept in a figure-of-eight motion through tall grass to catch insects and other small animals living on the vegetation.
- Beating tray: A white sheet positioned beneath tree branches; the branch is struck sharply, dislodging invertebrates onto the cloth.
- Plankton / pond net: Swept through open water or weed beds to catch aquatic larvae and microscopic plankton.
- Mammal trap (Longworth trap): A baited metal box trap used to capture small mammals like wood mice alive for identification.
3. Identification
Organisms are identified using a dichotomous key, which presents a succession of paired, mutually exclusive physical statements (such as 'wings present' vs 'wings absent') until the organism is classified.
4. Quantitative Surveys of Flora
- Qualitative survey: Records presence or absence of species, compiling a species inventory.
- Quantitative survey: Measures abundance or distribution.
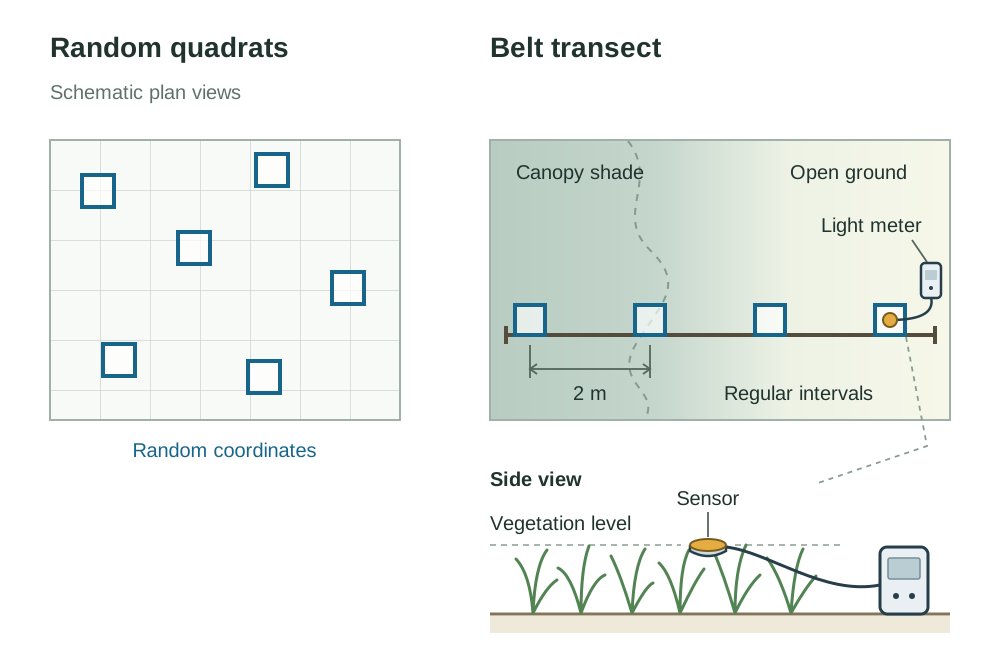
- Random quadrats: A square frame (typically ) placed using coordinates selected from a random number generator to avoid human selection bias. Ecologists record percentage cover (visual estimate of quadrat ground area occupied by a plant species) or percentage frequency (percentage of sample quadrats containing the species).
- Belt transect: A marked line laid across an environmental gradient (for example, from deep tree shade into open field). Quadrats are placed at regular intervals (for example every 2 m) along the line, or end to end, to show how species abundance changes along an abiotic gradient.
5. Measuring Abiotic Factors
Abiotic variables must be measured at the same sampling points where organisms are recorded:
- Air, soil, or water temperature: Alcohol-filled thermometer or digital temperature probe.
- Light intensity: Digital light meter held at vegetation level.
- Soil or water pH: Portable digital pH meter or universal indicator solution.
- Dissolved oxygen: Dissolved oxygen probe in aquatic habitats.
- Wind speed: Rotating-cup anemometer.
- Slope: Clinometer.
- Aspect: Magnetic compass.
- Soil moisture content: Weigh fresh soil, dry in an oven at 100 °C until mass remains constant, and calculate percentage mass loss.
6. Minimising Experimental Error
Ensure unbiased sampling using random coordinates, collect large sample sizes to improve representativeness, record weather conditions on the day, and repeat surveys across seasons to evaluate repeatability.