
The scientific method is the step-by-step way scientists test an idea: ask a question you can test, do a fair experiment, and decide what the results show. In the Junior Cycle exam, you will identify variables, select suitable equipment, interpret graphs, and evaluate whether evidence supports a hypothesis.
Stages of an Investigation
A question can be investigated scientifically only if you can change one factor and measure the result. For example, testing whether salt changes the boiling point of water is testable, but asking if nuclear power is morally right is a matter of opinion, not measurement.
In an investigation (the four stages of CBA 1, the Extended Experimental Investigation), scientists follow a clear cycle:
- Questioning and predicting: ask a testable question and write a hypothesis linking the variables.
- Planning and conducting: choose suitable apparatus, manage safety risks, work ethically (ask permission before testing people and do not harm living things), and carry out a fair test.
- Processing and analysing: record data in tables, plot graphs, and identify trends.
- Reflecting and reporting: evaluate limitations, suggest improvements, and present findings.
Scientific ideas are not fixed. Ptolemy's model placed Earth at the centre; later telescope observations, such as moons orbiting Jupiter, supported the Sun-centred model, so scientists changed their ideas.
Variables, Controls, and Selecting Equipment
A fair test changes only one factor at a time so that any observed effect is caused solely by that change.
| Variable Type | Meaning in an Experiment | Example: Plant Growth Test |
|---|---|---|
| Independent variable | The factor you deliberately change | Volume of water added daily (cm³) |
| Dependent variable | The factor you measure as the outcome | Height of the plant after two weeks (cm) |
| Controlled variable | Factors kept strictly identical | Same soil type, pot size, and temperature |
A control is a comparison setup where the independent variable is not applied. For example, placing boiled, dead peas in an insulated flask confirms that a temperature rise in another flask is caused by respiration in living peas.
Always pick the instrument that measures the quantity in your dependent variable:
- Volume: graduated cylinder (cm³)
- Time: stopwatch (s)
- Temperature: thermometer (°C)
- Mass: electronic balance (g)
- Potential difference: voltmeter (V)
- Electric current: ammeter (A)
- Resistance: ohmmeter (Ω)
Gathering Data: Accuracy, Precision, and Anomalies
Scientists collect quantitative data (measurements with numbers and units) and qualitative data (descriptions such as colour changes). Good evidence depends on how carefully you measure and work:
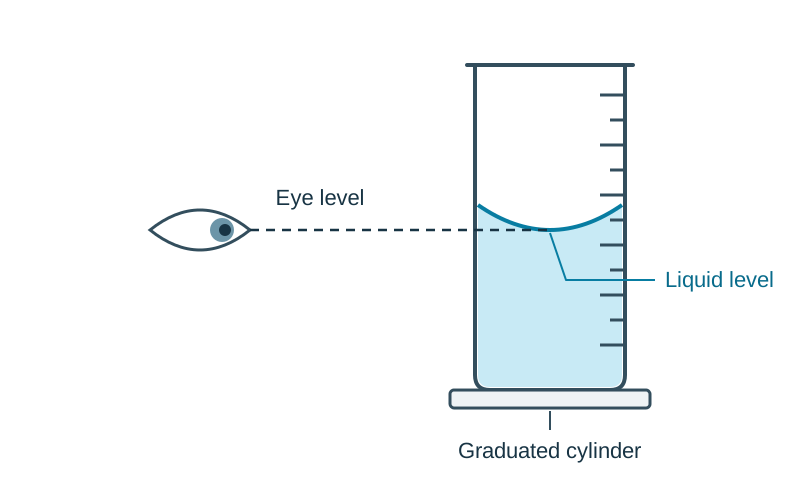
- Accuracy: how close a measured value is to the true value. Improve it by zeroing balances before use and reading liquid levels at eye level.
- Precision: how close repeated measurements are to each other, and how finely an instrument measures. A thermometer marked in 0.1 °C is more precise than one marked in 1 °C.
- Reliability: consistency of results. Repeat each trial at least three times, check for consistency, and calculate an average.
- Anomalous result: a measurement far outside the general pattern. Identify the point, suggest a likely reason (such as a misread scale or delayed timing), repeat the trial, and leave it out of your average.
Tables, Graphs, and Drawing Conclusions
Record primary data in a results table with separate columns for the independent variable and dependent variable (including units in headings), plus columns for three repeats and an average.
When plotting graphs from your table:
- Put the independent variable on the x-axis and the dependent variable on the y-axis, with units in brackets.
- Choose a scale in steps of 2, 5, or 10 that fills at least half the grid.
- Draw a smooth curve or straight line of best fit that balances points evenly on both sides, ignoring obvious outliers.
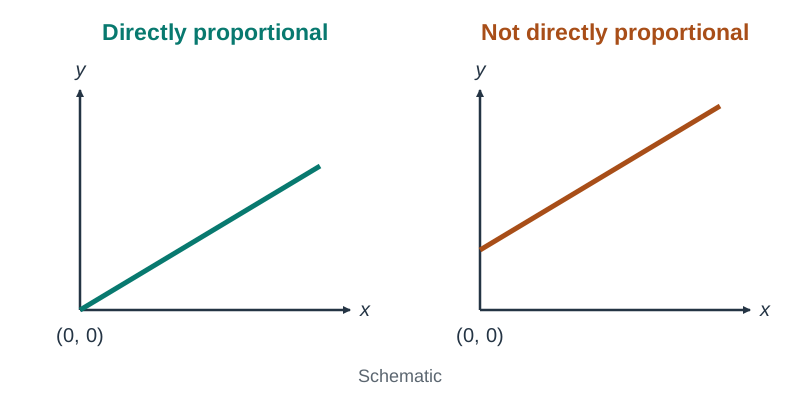
- A relationship is directly proportional only if the line of best fit is completely straight and passes directly through the origin (0, 0).
- In your conclusion, state clearly whether the data supports or does not support your hypothesis.
Key terms
- Variable
- Any factor or condition in an experiment that can change or be changed.
- Hypothesis
- A testable prediction that defines and links the independent and dependent variables.
- Independent Variable
- The factor deliberately changed by the investigator in an experiment.
- Dependent Variable
- The factor measured to observe the effect of changing the independent variable.
- Controlled Variable
- Any condition kept strictly constant throughout an experiment to guarantee a fair test.
- Accuracy
- How close a measured experimental value is to the true or accepted value.
- Precision
- How close repeated measurements are to each other, reflecting the fineness of the measuring instrument.
- Reliability
- The consistency of experimental results when trials are repeated under identical conditions.
Check yourself
What is the definition of a variable in an experiment?
Any factor or condition that can change or be changed.
Name the instrument used to measure potential difference.
A voltmeter (measured in volts, V).
Give one reason an anomalous result might occur during an experiment.
A measuring instrument was misread, timing was started late, or apparatus was not cleaned between trials.
What two conditions must a graph meet to show that two variables are directly proportional?
The line of best fit must be completely straight and pass directly through the origin (0, 0).