

This topic is about how populations grow, how old or young they are, and why people move from one place to another. The Junior Cycle exam tests your ability to interpret population data, explain the Demographic Transition Model, compare Ireland with a developing country, and analyse migration.
Measuring Population Change and Density
Demography is the study of human populations. In Ireland, the census is taken by the Central Statistics Office (CSO) about every five years to help the government plan future schools, housing, and hospitals.
- Birth rate: the number of live births per 1,000 people each year.
- Death rate: the number of deaths per 1,000 people each year.
- Natural change: the difference between birth rate and death rate (birth rate − death rate). If the birth rate is higher, there is a natural increase; if the death rate is higher, there is a natural decrease.
Population density measures how crowded a place is: Population density = total population ÷ total area in km².
Dublin is densely populated: many people per km², with many services and good transport. The West of Ireland is sparsely populated: few people per km², with fewer services.
The Demographic Transition Model & Population Pyramids
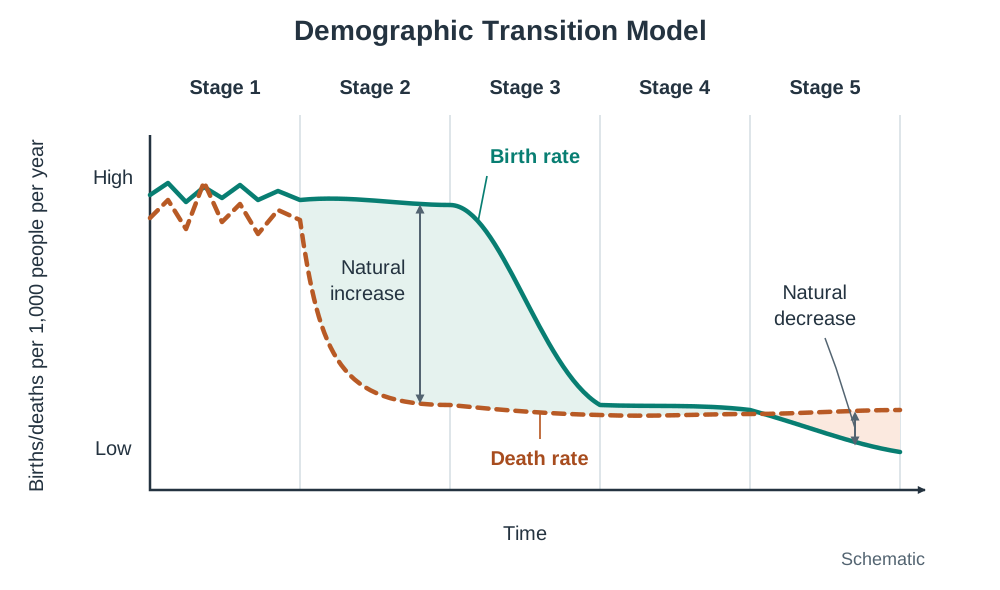
The Demographic Transition Model (DTM) shows how birth and death rates change as a country develops economically:
- Stage 1 (High Fluctuating): high birth and death rates due to disease and famine; population stays low (e.g. Somalia in the past).
- Stage 2 (Early Expansion): death rate falls rapidly due to cleaner water and healthcare, while birth rate stays high, creating rapid population growth (e.g. Nigeria).
- Stage 3 (Late Expansion): birth rate falls as family planning and female education spread, so growth slows (e.g. Brazil).
- Stage 4 (Low Expansion, also called Low Fluctuating): low birth and death rates; population is high and stable (e.g. Ireland).
- Stage 5 (Decline): birth rate drops below death rate, causing population to shrink (e.g. Germany).
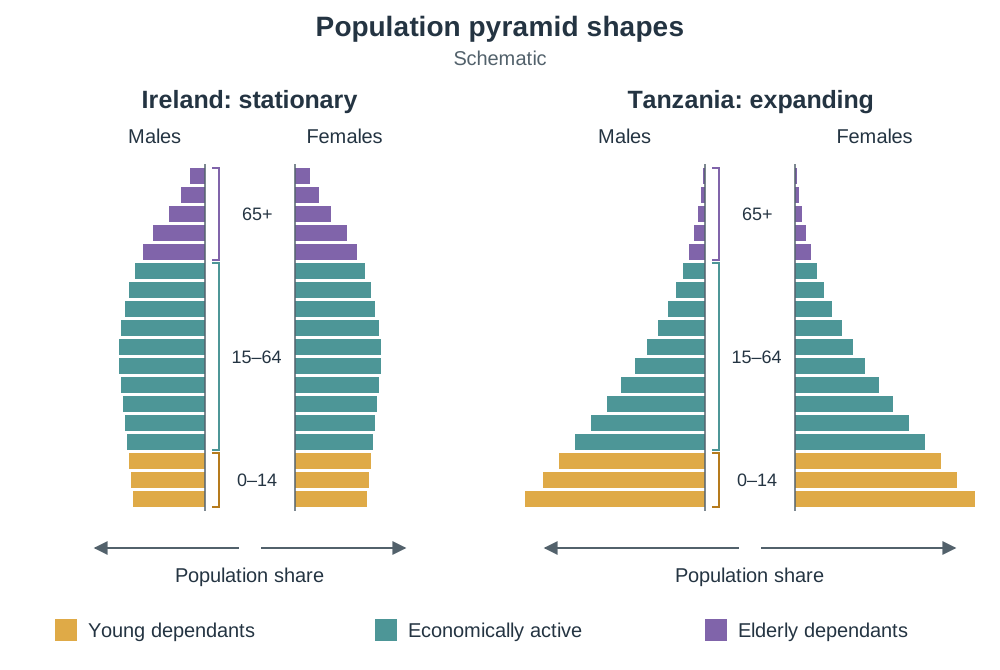
A population pyramid shows the age and sex make-up of a population. Learn the three age groups off by heart: 0–14 young dependants, 15–64 economically active, 65+ elderly dependants. Link each group to spending: schools, taxes, and pensions.
Comparing Ireland and Tanzania
A country's population structure depends on its level of development.
| Feature | Ireland (Developed) | Tanzania (Developing) |
|---|---|---|
| Population change | During the Great Famine (1845–1849) about one million people died and one million emigrated, reducing the population from 8.2 million to 6.5 million. Emigration kept it falling until the 1960s, before modern growth and inward migration. | Rapid population growth in recent decades due to high birth rates, while healthcare improvements lowered death rates. |
| Age structure | Stationary pyramid with high life expectancy (over 80 years) and an ageing population. | Expanding pyramid with a wide base, meaning over 40% are young dependants under 15. |
| Planning challenge | Funding state pensions, healthcare for older citizens, and nursing homes. | Providing enough primary schools, teacher training, and clean drinking water. |
Migration: Causes, Consequences, and Case Study
Migration is the movement of people from one place to another to live. Emigration is leaving your home country; immigration is moving into a new country. People also move internally from rural areas to cities for jobs in industry and services, or for third-level education.
- Push factor: a negative reason driving people away from home, such as war, famine, poverty, or unemployment.
- Pull factor: a positive attraction drawing people to a new destination, like peace, jobs, higher wages, and better schools and hospitals.
- Refugee: a person forced to flee their own country because of war, violence, or persecution, who cannot return safely.
- Asylum seeker: someone who has applied for protection and is awaiting a decision.
Example: Polish migration to Ireland (after 2004)
- Push factors in Poland: high unemployment in rural areas and low wages.
- Pull factors in Ireland: jobs during the Celtic Tiger boom, higher wages, and free movement within the EU.
- Effect on Poland (donor area): brain drain, as skilled workers left shortages in construction and healthcare, though families received remittances (money sent home).
- Effect on Ireland (host area): migrant workers filled labour shortages and added cultural diversity, but extra demand placed pressure on housing. Globalisation makes this international movement faster and easier.
Key terms
- Birth Rate
- The number of live births per 1,000 people in a population each year.
- Death Rate
- The number of deaths per 1,000 people in a population each year.
- Population Density
- The average number of people living per square kilometre (people per km²).
- Emigration
- Leaving your own country to live permanently in another country.
- Immigration
- Moving into a new country to live there.
- Refugee
- A person forced to flee their own country because of war, violence, or persecution, and who cannot return safely.
- Brain Drain
- The loss of educated and skilled workers who emigrate from their home country to work abroad.
- Remittances
- Money sent home by migrant workers to support their families in their country of origin.
Check yourself
What is the formula used to calculate population density?
Total population ÷ total area in km².
Why does the death rate fall sharply in Stage 2 of the DTM?
Improvements in healthcare, clean drinking water, and sanitation reduce premature deaths.
Which age group on a population pyramid forms the economically active workforce?
People aged 15 to 64 years old.
Are famine and war push factors or pull factors?
Push factors.
What is the term for money sent home by migrants to their families?
Remittances.