

Presenting findings and perspectives is the final communication stage of a business investigation. Your job at this stage is to turn a pile of research into a clear message that a particular group of people—such as a bank manager, a board of directors, your employees, or your customers—can understand and act on. At Leaving Certificate Higher Level, these skills are assessed twice: in the written examination worth 60% of the marks, and in the Business Alive Investigative Study report, worth 40%, which you submit digitally to the State Examinations Commission (SEC) in sixth year. Mastering this topic means knowing how to match your communication format to your audience, present numbers and business relationships in clear graphics, interpret data using solid business concepts, and reflect honestly on how your research shaped your view.
Purpose, Audience, and Communication Channels
Every business presentation begins with two questions: who is the target audience, and what action should they take? Communicating findings to a commercial loan manager requires formal, risk-focused documentation, whereas pitching an operational change to factory staff calls for direct, collaborative discussion. Business communication falls into four main channels:
- Written communication: Formats like formal reports, memos, business letters, and emails provide a permanent, auditable record. Written documents allow recipients to analyse complex figures and legal details at their own pace. The drawbacks are that feedback is slow, and if the reader misunderstands something there is nobody there to explain it immediately.
- Oral communication: Spoken interactions, including board presentations, team briefings, and meetings, provide immediate two-way feedback, personal tone, and real-time discussion. Its main limitation is the absence of a permanent record unless formal minutes or recordings are kept.
- Visual communication: Tools such as charts, diagrams, tables, and infographics make complex patterns and numerical relationships instantly accessible. Visuals rarely stand alone; they need explanatory commentary so the audience does not misread them.
- Multimodal communication: Combines two or more modes in a single delivery, such as an oral slide presentation supported by data graphics and a printed executive summary. This engages different learning styles, offering high-level visual summaries alongside detailed written evidence.
Choosing the Format: Audience to Format to Justification
| Audience | Best format | Justification (where marks are earned) |
|---|---|---|
| Bank or investor | Formal written report with financial tables | Gives a permanent, auditable record; lets the lender study cash-flow figures before committing funds. |
| Board of directors | Multimodal: oral presentation with charts plus a written briefing note | Charts give the headline picture quickly; the written note supplies the operational detail for decision-making. |
| Employees affected by a change | Face-to-face team meeting (oral) | Allows immediate two-way feedback so concerns can be answered on the spot, reducing resistance to change. |
| Consumers | Visual: infographic or short video on social media | Simple, shareable, and instantly understood by a non-expert audience. |
| Local community | Public information meeting plus a press release | Demonstrates transparency and allows local residents to voice concerns directly. |
| Regulator or public body | Formal written submission | A precise, dated, permanent record is required for statutory compliance. |
Applied Scenario: Thurles Textiles Ltd
Thurles Textiles Ltd plans to close one of its two manufacturing lines. Here is how management should communicate with three distinct audiences:
- Affected factory staff: Use a face-to-face team meeting (oral). This provides personal contact and allows workers to ask questions about redundancy terms or redeployment immediately, reducing panic and workplace rumours.
- The commercial lending bank: Submit a formal written report with updated cash-flow forecasts. The bank requires a permanent, verifiable document to assess whether the restructuring leaves the firm capable of servicing its loans.
- Local media: Issue a formal written press release. This gives the firm control over its public message, ensuring accurate quotes and facts about local employment are reported.
Reading the Command Word Before You Write
The specification publishes the exact meaning of each action verb, and exam command words follow it. Aligning your writing with the command word prevents writing a descriptive answer when an evaluative one is demanded.
| Command word | What you must actually do |
|---|---|
| Outline | Give the main points only—essential information, no deep development. |
| Describe | Give a detailed account of the main points, using examples or diagrams if helpful. |
| Explain | Give a detailed account including reasons or causes. The word 'because' should appear. |
| Interpret | Recognise trends and draw conclusions from the information you are given. |
| Analyse | Break the material down, identify the parts and how they relate, and interpret it to reach conclusions. |
| Discuss | Offer a balanced review with a range of arguments, supported by evidence. |
| Evaluate (data) | Examine data, make a judgement, say how the evidence supports or rejects a conclusion, and identify the limitations of the data. |
| Appraise | Judge the value or quality of information or a piece of work. |
| Synthesise | Combine different ideas or findings to create new or enhanced understanding. |
| Present | Show something for others to consider—set it out clearly and logically for the reader. |
| Assess | Judge, evaluate, or estimate the value or importance of something. |
Notice that evaluate in this subject requires naming the limitations of the evidence. An evaluation that never says what the data cannot tell you is incomplete.
Visual Data Displays: Charts, Diagrams, and Mathematical Accuracy
Visual displays must match the structure of the underlying data rather than serve as decorative space-fillers. As a general rule: a chart shows numbers, while a diagram shows relationships.
Charts for Quantitative Data
| Graphic Display | Primary Data Purpose | Practical Business Application |
|---|---|---|
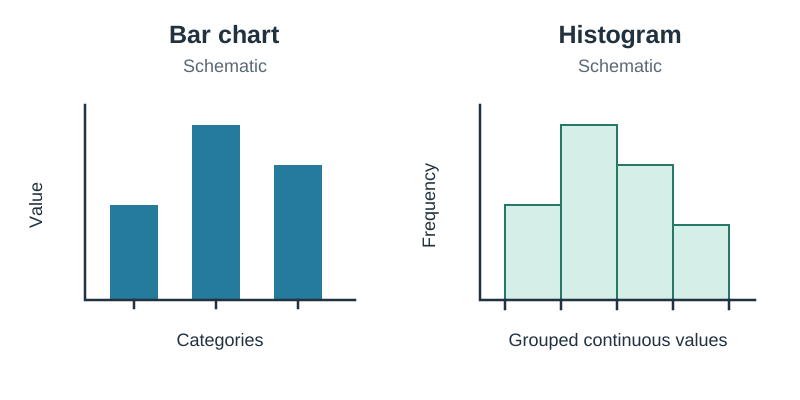
| Bar chart | Comparing discrete categories or intervals separated by spaces. | Comparing quarterly sales revenue across regional branches in Leinster and Munster. |
| Line graph | Tracking continuous quantitative data and trends over time. | Plotting monthly gross profit margins or inflation movements over 24 months. |
| Pie chart | Illustrating proportions of a single whole where components sum to 100%. | Displaying the breakdown of percentage market share held by retail grocery multiples. |
| Histogram | Showing frequency distributions across continuous grouped data (bars touch). | Grouping warehouse employee hourly wages into contiguous €2.00 pay bands. |
| Table | Presenting exact numerical figures and multi-variable data systematically. | Comparing competitor subscription costs, user limits, and contract lengths side by side. |
Diagrams That Present Business Analysis
| Diagram | What it shows | When to use it in your findings |
|---|---|---|
| Stakeholder map | Stakeholders plotted by level of interest and level of power or influence. | Showing which groups must be consulted first regarding a planned expansion. |
| SWOT grid | Strengths, Weaknesses, Opportunities, and Threats in four quadrants. | Summarising the internal and external position of a business on one page. |
| Force-field analysis | Arrows showing forces driving a change versus forces resisting it. | Presenting why employee fear of new software may outweigh operational cost savings. |
| Business model canvas | Nine building blocks: key partners, key activities, key resources, value proposition, customers, customer relationships, channels, costs, revenues. | Presenting how a new venture creates, delivers, and captures value. |
| Gantt chart | Tasks and milestones plotted against calendar dates. | Illustrating a project schedule and displaying which deadlines have been achieved. |
| Organisation chart | Management hierarchy, spans of control, and reporting lines. | Highlighting communication bottlenecks or operational delays in an order process. |
Mathematical Precision: Pie Charts and Percentage Change
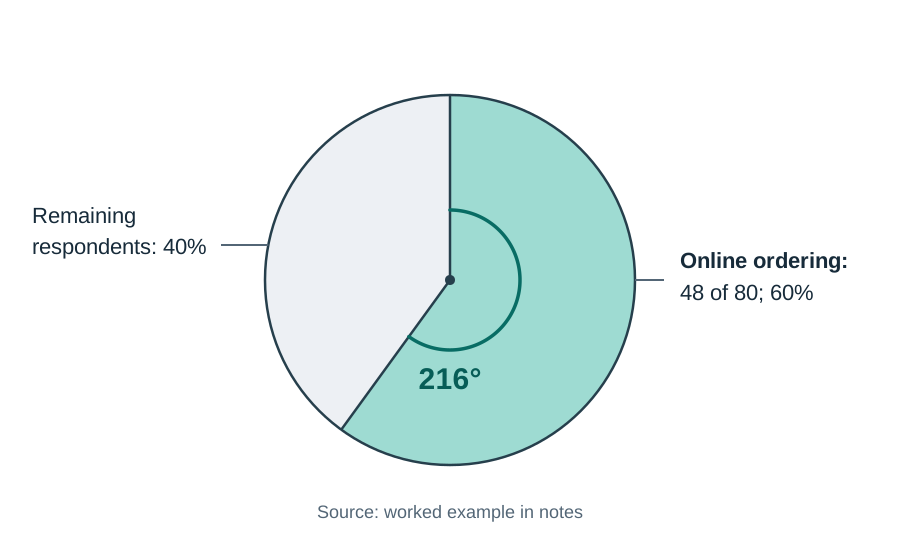
When constructing a pie chart, calculate both the percentage and the sector angle in degrees:
For example, if 48 out of 80 surveyed customers prefer online ordering:
To quantify movements across time, calculate percentage change:
A chart is only credible evidence if it includes four elements: a descriptive title stating the topic and timeframe, labelled axes with units (€, %, units), a sensible scale (starting at zero for bar charts to prevent distortion), and an explicit data source citation directly underneath.
Interpreting Findings: The Four-Step Analysis Habit
Simply reciting raw numbers is not business analysis. An examiner awards marks for interpreting what data means for business operations. A dependable four-step habit for unpacking data involves reviewing four elements: time, trend, why, and business concept.
- Time: State the period under review (the comparative quarters or financial years).
- Trend: Identify the direction of movement and calculate the precise percentage change.
- Why: Explain the operational, financial, or macroeconomic cause behind the shift.
- Business concept: Link the finding to established business principles or cross-cutting themes, such as price elasticity of demand, working capital management, or digital transformation.
Note on exam technique: Use this sequence as a thinking habit, but write your answer in continuous professional sentences. Never write down study-aid labels in an exam script.
Contrast: Weak vs Strong Commentary
- Weak commentary: 'The line graph shows that our online sales went up from €50,000 to €80,000.'
- Strong commentary: 'Between Q1 2024 and Q1 2025, online sales increased by €30,000, representing growth of 60%. This sharp rise followed the rollout of a nationwide click-and-collect logistics service. This is the cross-cutting theme of digital transformation in action: by changing how the product reaches the customer, the business grew its sales revenue.'
Telling Findings, Conclusions, Perspectives, and Recommendations Apart
Blurring findings, conclusions, perspectives, and recommendations is a common reason students lose marks in Higher Level evaluations. Keep them strictly demarcated:
| Component | Definition | Evidentiary Role | Applied Commercial Example |
|---|---|---|---|
| Finding | What the research discovered; an objective, verified datum. | Unfiltered evidence; establishes 'what is'. | '78% of surveyed fleet drivers reported anxiety over rural fast-charging availability.' |
| Conclusion | What the research proves when you put the findings together. | Factual deduction; answers the core research question. | 'Immediate 100% fleet electrification is an operational risk due to rural charging infrastructure deficits.' |
| Perspective | How you now believe the issue should be viewed across different groups. | Evaluative stance; weighs stakeholder interests and trade-offs. | 'While fleet decarbonisation supports corporate sustainability, protecting delivery punctuality remains essential for client retention.' |
| Recommendation | What management must do next to solve the issue or seize an opportunity. | Strategic proposal; actionable and practical. | 'Procure 15 electric vans for urban routes within six months, while retaining diesel vans for long-haul routes.' |
All recommendations should follow the SMART criteria: Specific, Measurable, Achievable, Relevant, and Time-bound. Clearly identify the manager responsible, the estimated cost, and how risks will be managed.
Evolving Perspectives, Research Limitations, and Data Protection
The Descriptors of Quality for the Business Alive Investigative Study reward students who reflect on how their perspectives were influenced by the research. The same reflective skill is useful in the written examination, where you may be asked to justify a viewpoint. Business investigations rarely confirm simplistic initial ideas.
Documenting an Evolving Perspective
Structure your reflection around what you believed at the outset, how your view was refined, and the exact evidence that caused the change. Place this reflection in your conclusion section, alongside your reflections on project planning and research constraints.
- Starting view: You may have assumed that lowering unit prices is the primary driver of customer brand loyalty.
- Refined perspective: You realised that reliable customer support and transparent ethical sourcing outweigh minor price differences for repeat buyers.
- The evidence: Cite the specific primary findings, customer interviews, or published reports (such as Central Statistics Office retail data) that caused your viewpoint to evolve.
Exam tip: Do not invent a complete reversal of opinion just to show reflection. Research frequently reinforces an original view. The skill is explaining how and why the data added depth or revealed complications.
Identifying Research Limitations
Acknowledging research limitations demonstrates critical thinking. Limitations may include small primary sample sizes, unreturned supplier questionnaires, geographic restrictions, or dated secondary industry statistics. Explain how these gaps affect the certainty of your conclusions.
Presenting Findings About People: Data Protection Duties
When your findings involve surveys, interviews, or staff performance records, the General Data Protection Regulation (GDPR) and the Data Protection Act 2018 apply. When presenting these findings:
- Obtain and process data fairly: Inform respondents of the study's purpose and obtain consent before gathering data.
- Keep data to a specified, lawful purpose: Never reuse research data for unrelated marketing or commercial purposes.
- Anonymise and aggregate: Present findings as totals and percentages (for example, '68% of employees surveyed'), never naming individuals or disclosing identifying personal details.
- Keep data safe and secure: Store digital records securely and delete research files once the report is completed.
- Cite the Data Protection Commission as the supervisory authority in Ireland overseeing compliance.
Report Layouts and Answering Evaluative Questions
Report Formats: Written Exam vs Digital AAC Coursework
- The Written Examination (60%): If an exam question asks you to draft a business report or memo, use the professional layout. Include a header block (To, From, Date, Subject), a Terms of Reference section (setting out the scope and purpose), numbered findings, evidence-based conclusions, SMART recommendations, and a formal sign-off. Note that the 2027 paper format is newly introduced, so master this layout as an essential communication skill rather than relying on past mark allocations.
- The Business Alive Investigative Study (40%): The coursework report is submitted digitally according to the template and word count specified in the annual SEC brief. You do not submit your rough project plan. Instead, you write reflective evaluations within the digital document explaining how planning supported your work. Teachers must authenticate that the submission is your own authentic work through regular classroom oversight, but official guidelines prohibit teachers from correcting or redrafting student reports.
Acknowledging Sources
The Communicating descriptor of quality awards top marks only when sources are clearly acknowledged. A chart or citation needs two things:
- In-text label under the graphic: 'Source: Central Statistics Office, Retail Sales Index, March 2026.' For primary research: 'Source: Author's own survey of 150 customers, GreenGroves Ltd, February 2026 (n = 150).'
- Full reference in your sources list: Author or body, publication year, title, and URL with access date.
The 'To What Extent Do You Agree?' Answer Structure
Evaluation questions require a structured, two-sided review followed by a reasoned verdict:
- Arguments supporting the statement: Two or three developed points, each stated, explained, and illustrated with examples.
- Arguments against the statement: Two or three developed points examining counterarguments or alternative perspectives.
- Your judgement, with a reason: A concluding paragraph that takes a clear stance and justifies it using your strongest point. Never conclude with 'there are arguments on both sides'.
Key terms
- Multimodal communication
- The practice of combining two or more communication channels (such as spoken narration, written text, and visual data graphics) into a single business presentation.
- Business Alive Investigative Study
- The 40% Additional Assessment Component (AAC) in Leaving Certificate Business involving independent research, evaluation, and a digitally submitted coursework report based on an SEC brief.
- Terms of Reference
- The opening section of a formal business report defining its scope, investigative purpose, authorising body, and specific objectives.
- Finding
- An objective, verified piece of factual data or evidence gathered directly through primary or secondary business research.
- Conclusion
- A reasoned deduction that synthesises research findings to directly answer the central investigation question.
- Perspective
- An informed, evaluative stance on a business issue that weighs competing stakeholder priorities, ethical considerations, and commercial trade-offs.
- Recommendation
- A specific, actionable proposal following the SMART framework, designed to resolve an issue or capitalise on an opportunity identified in the findings.
- Research limitations
- Constraints within an investigation—such as small sample sizes, geographical boundaries, or dated secondary figures—that restrict the certainty or wider application of findings.
- Authentication
- The formal process required by the State Examinations Commission whereby teachers verify through regular engagement that coursework submitted for assessment is entirely the student's own work.
- GDPR
- The General Data Protection Regulation; European Union law governing the collection, processing, security, and lawful storage of personal data, supported in Ireland by the Data Protection Act 2018.
- Price elasticity of demand
- A measure of the responsiveness of the quantity demanded of a good or service to a change in its price.
- Digital transformation
- A cross-cutting specification theme examining how businesses integrate digital technologies, data analytics, and automation to alter operations and customer interactions.
Check yourself
A café's weekly customer footfall fell from 1,250 to 1,000 after an adjacent car park closed. Calculate the percentage change and provide a one-sentence business interpretation.
Percentage change = ((1,000 - 1,250) / 1,250) * 100 = -20%. Customer footfall declined by 20% following the car park closure, indicating that convenient physical access is a major driver of walk-in sales.
Calculate the sector angle on a pie chart for an employee group representing 35% of an organisation's total workforce.
Angle = 0.35 * 360° = 126°.
GreenGroves Ltd wants to inform 300 local customers about an upcoming packaging change. Recommend and justify one appropriate communication channel.
A visual infographic shared on the firm's social media and displayed in-store. It is instantly understandable to consumers, inexpensive to distribute locally, and easily shareable, whereas a formal written report would not be read by retail shoppers.
What is the critical distinction between a research finding and a research conclusion?
A finding is an objective piece of raw data or evidence gathered directly by research, whereas a conclusion is a reasoned deduction that interprets what that finding proves in relation to the investigation question.
Name two obligations a business researcher has under GDPR and the Data Protection Act 2018 when presenting survey findings about customers.
Data must be processed fairly by obtaining prior consent for a specified purpose, and findings must be anonymised and aggregated so individual respondents cannot be identified.
What four elements are expected in the Communicating descriptor of quality for the Business Alive Investigative Study report?
Clear data, information, and analysis; a range of relevant graphics used appropriately; coherent and consistent language throughout; and clearly acknowledged supporting references and reflections on the study.