

Graphicacy is the skill of constructing, reading, and interpreting images such as tables, graphs, and charts. In the Junior Cycle examination, you will read data tables, plot bar graphs, interpret climographs, and describe trends using exact figures.
Reading Geographical Data Tables and Models
Data tables organise geographical facts into rows and columns, allowing straightforward comparison between places or years.
- Read the title first to identify the place, subject, and time period.
- Check the units of measurement, such as millimetres (mm), degrees Celsius (°C), percentages (%), or population in thousands or millions.
- Track across the relevant row and column to locate exact figures.
- Remember that on an axis labelled 'population in millions', a figure of 2.4 represents 2,400,000 people.
- On a graph with two lines, read each line against the key, then compare them: check which line is higher, and whether the gap is widening or narrowing.
- Where two lines cross, the values are equal; the gap between them often answers questions about natural increase or decrease.
Graph Types and Construction
Different graphs suit different types of geographical data.
| Graph Type | Best Used For | Example |
|---|---|---|
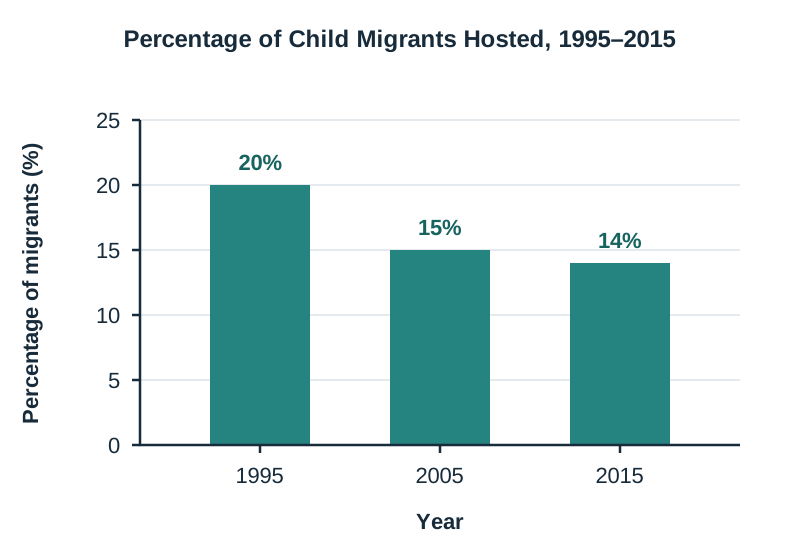
| Bar graph | Separate categories of data | Child migrants hosted per year |
| Line graph | Continuous change over time | City population growth since 1950 |
| Pie chart | Showing parts of a whole that sum to 100% | Reasons visitors travel to Ireland |
| Climograph | Comparing monthly temperature and rainfall | Climate of a Mediterranean city |
| Population pyramid | Age groups and sex of a population | Ireland's ageing population |
When drawing a graph in your exam, follow these four rules:
- Write a clear title stating what the graph shows.
- Label both axes with names and units (e.g. 'Year' and 'Rainfall (mm)').
- Use an even scale starting at zero that covers the highest figure without uneven jumps.
- Draw bars of equal width with equal gaps, using a pencil and ruler.
Reading Climographs
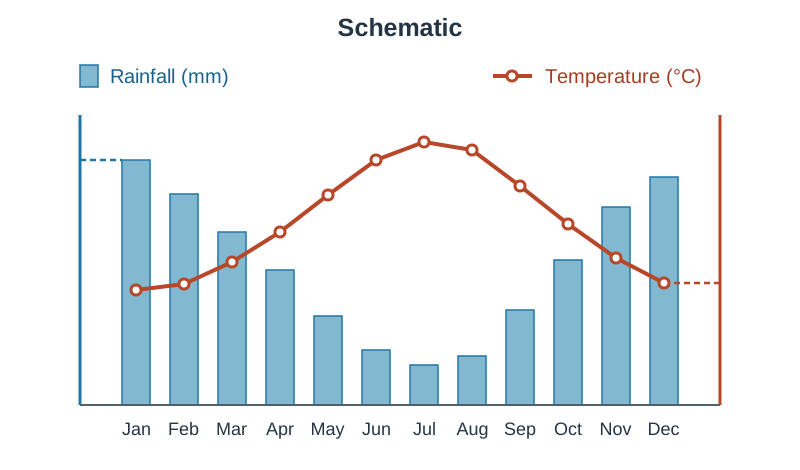
A climograph is a graph that shows a place's average monthly temperature and rainfall together, with a scale on each side.
- Precipitation is shown as vertical bars, measured in millimetres (mm).
- Temperature is shown as a continuous line, measured in degrees Celsius (°C).
- Months run horizontally along the bottom from January to December.
- Check the axis labels and key every time rather than assuming which side shows rainfall or temperature.
- Identify the warmest, coldest, wettest, and driest months by matching data points to their correct scale.
Calculations and Describing Trends
Exam questions regularly require simple calculations and trend analysis:
- Difference: larger value − smaller value (e.g. Dublin population minus Mayo population: 1,347,359 − 130,507 = 1,216,852 people).
- Percentage of a total: (part ÷ total) × 100. For example, 54,967 of Mayo's 130,507 people are under 35, so (54,967 ÷ 130,507) × 100 = 42%.
- Temperature range: warmest month − coldest month (e.g. 27°C − 12°C = 15°C).
- Missing pie-chart slice: 100% − total of other slices (e.g. 100% − (38% + 31% + 11%) = 20%).
- A fall from 20% to 14% is a drop of 6 percentage points.
When describing a trend, state the overall direction (increased, decreased, or fluctuated) and quote starting figures, ending figures, years, and units. To predict a future value, continue the trend: state the expected figure, the target year, and the pattern it is based on.
Key terms
- Graphicacy
- The ability to construct, read and interpret a range of images including maps, photographs, tables, graphs, and charts.
- Climograph
- A dual-axis graph that shows a place's average monthly temperature and rainfall together, with a scale on each side.
- Trend
- The general direction in which data changes or develops over a period of time.
- Temperature range
- The numerical difference between the warmest and coldest average monthly temperatures.
- Bar graph
- A chart using rectangular bars of equal width and spacing to compare quantities across separate categories.
- Pie chart
- A circular chart divided into proportional slices representing parts of a whole that total 100%.
- Population pyramid
- A back-to-back bar graph displaying the age structure and sex distribution of a population.
Check yourself
What does graphicacy mean?
The ability to construct, read and interpret a range of images including maps, photographs, tables, graphs, and charts.
A pie chart has three slices valued at 35%, 25%, and 15%. What is the value of the missing slice?
100% − (35% + 25% + 15%) = 25%.
How do you calculate the annual temperature range from a climograph?
Subtract the coldest month's average temperature from the warmest month's average temperature.
What four elements are required to earn full marks when drawing a bar graph?
A clear title, labelled axes with units, an even scale starting at zero, and bars of equal width and spacing.